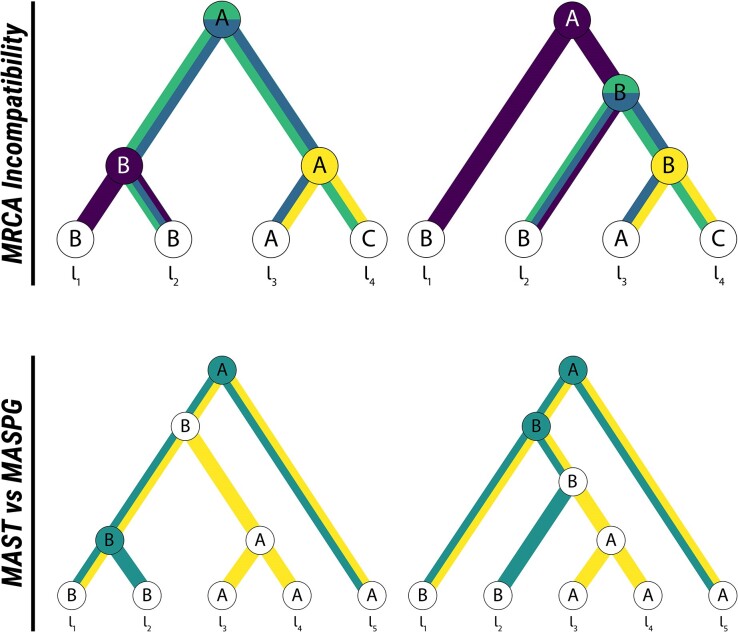
Fig. 1.
An illustration of the two measures of phylogeographic incompatibility presented in this paper: (Upper Panel) two phylogeography diagrams illustrating the MRCA-based incompatibility measure. Paths to MRCA of pairs of leaves with conflicting locations are highlighted in colors corresponding to leaf pairs (purple, ; blue, ; green, ; yellow, ). The nodes causing the incompatibility are likewise highlighted. There are four conflicting MRCAs here, so the unweighted incompatibility is 4. (Lower Panel) Two phylogeography diagrams illustrating the difference between the MAST (in yellow) and the MASPG (in green). The MASPG includes internal node locations, and the internal nodes that contribute to the MASPG are highlighted in green. Due to the requirement of matching internal node locations, the MASPG has size 3, while the MAST, which does not have this constraint, has size 4.

