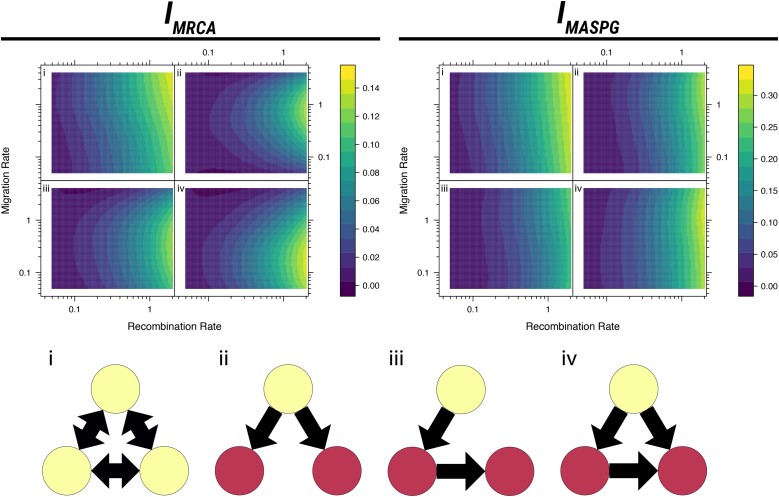
Fig. 2.
Upper panel: Effect of evolutionary parameters on phylogeographic incompatibilities, using 100 simulations at each calculated pair of parameter values. The plots show smoothed surfaces of each phylogeographic incompatibility measure, labeled with the corresponding network structure. Lower panel: Models of the network structures. The network structures are illustrated with locations in which the population can originate colored in yellow.

