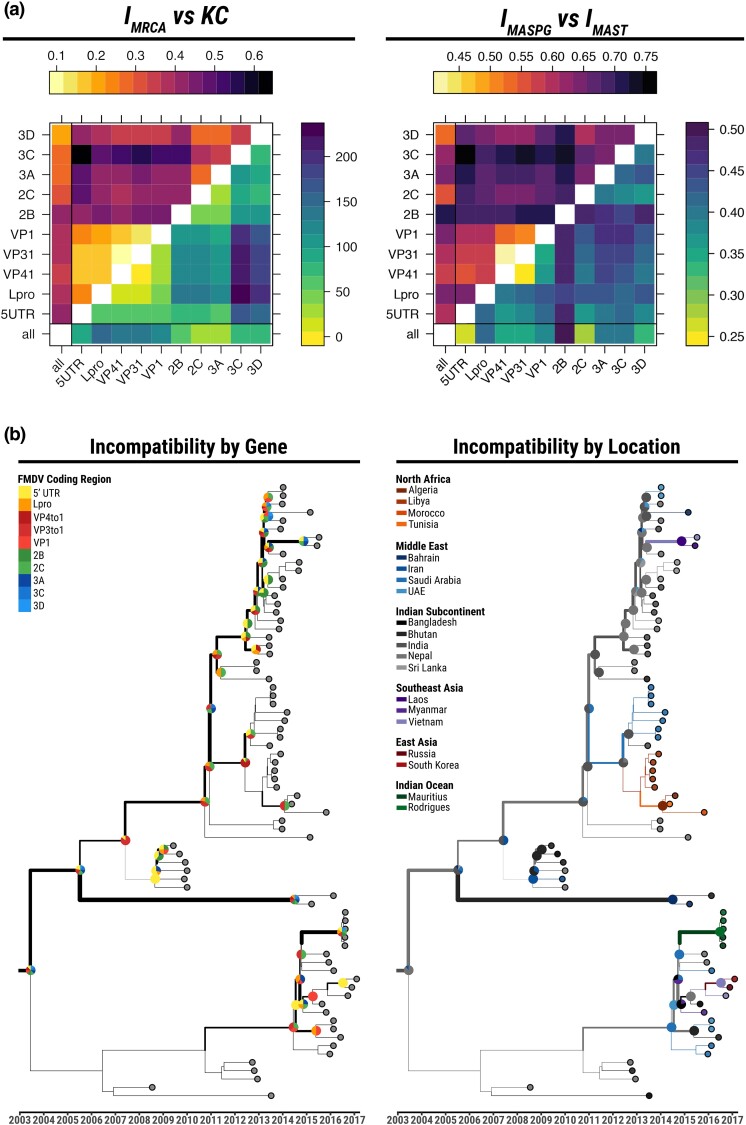
Fig. 3.
Phylogenetic and phylogeographic incompatibilities estimated for the FMDV O/ME-SA/Ind-2001 epidemics. Panel a—Comparisons of various incompatibility measures between phylogeographies reconstructed from segments of the FMDV O/ME-SA/Ind-2001 genome. In the plot on the left, (upper triangle) is compared to KC (lower triangle). In the plot on the right, (upper triangle) is compared to (lower triangle). Panel b—Illustration of the incompatibilities along the maximum clade credibiltiy (MCC) tree. The line-width of each branch represents the total amount of phylogeographic MRCA incompatibilities between all trees built from individual genomic regions and the whole-genome tree. Pie charts represent the distribution of MRCA incompatibilities per genomic region (left) and per country (right) on the corresponding nodes. Branch colors on the right topology represent the phylogeography reconstructed from the WGS alignment.

