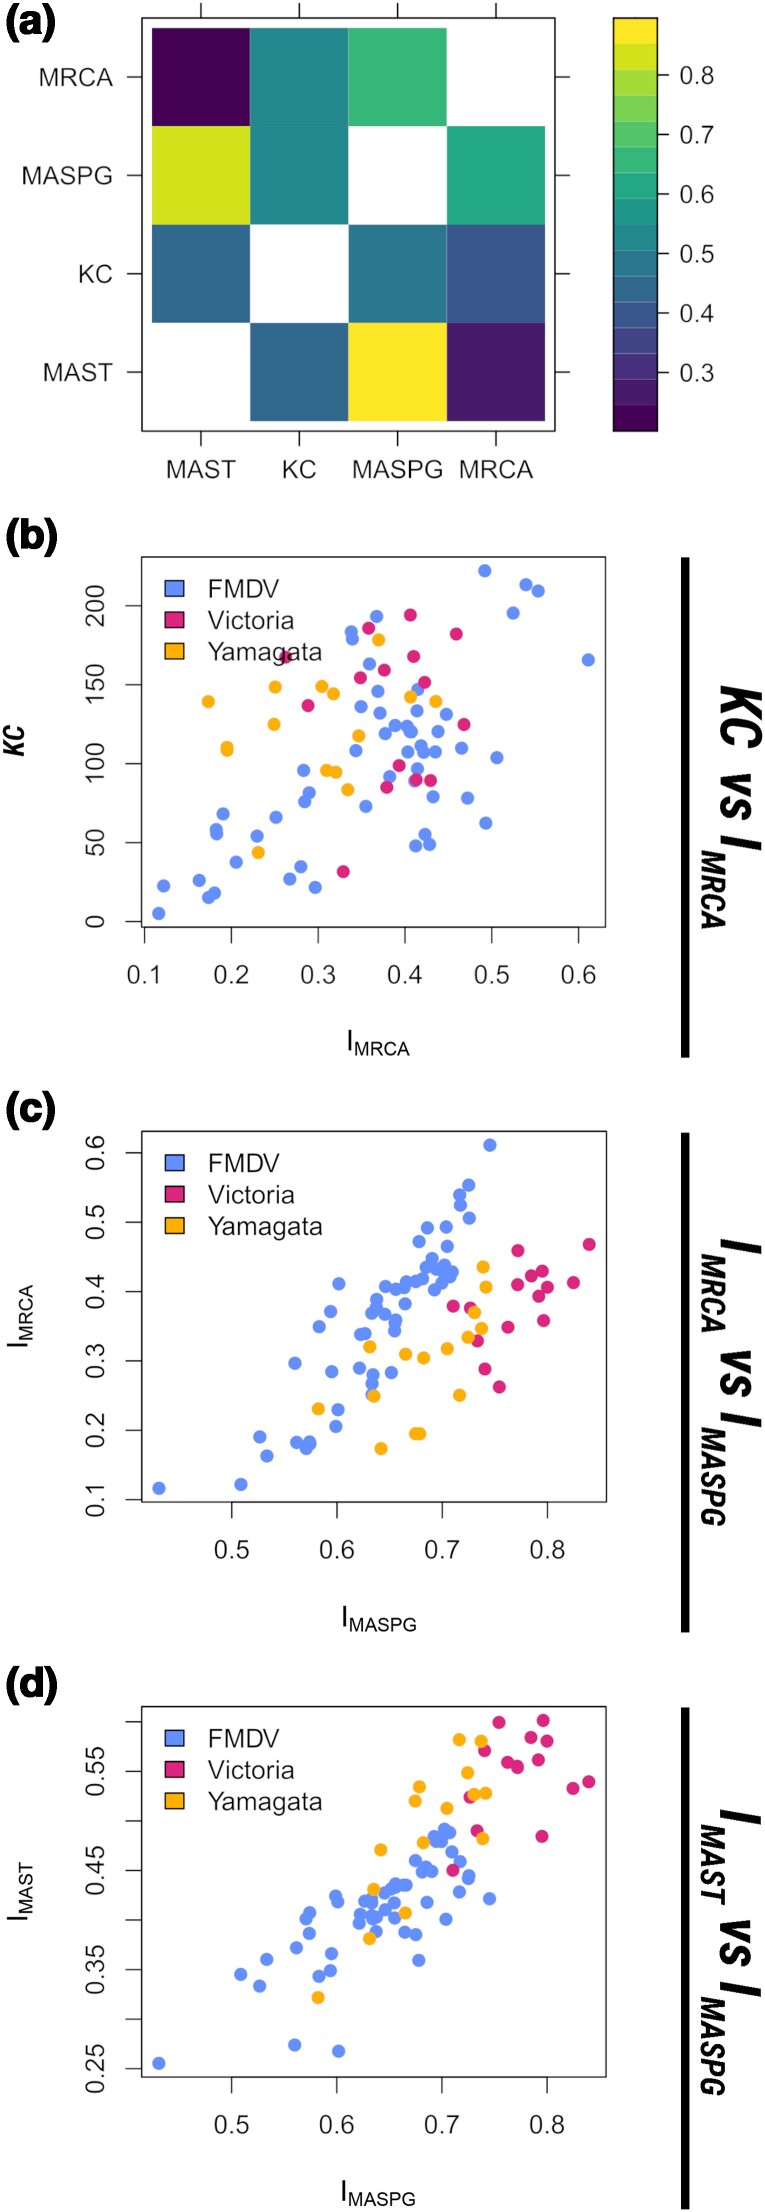
Fig. 5.
Illustrations of the correlations between the measures investigated by this study. a) Correlations between incompatibility measures. The upper triangle shows the Pearson correlation, and the lower triangle shows the Spearman correlation. b, c, d) Scatter plots illustrating the correlations between incompatibility measures for the three viruses whose phylogeographies were investigated in this paper.

