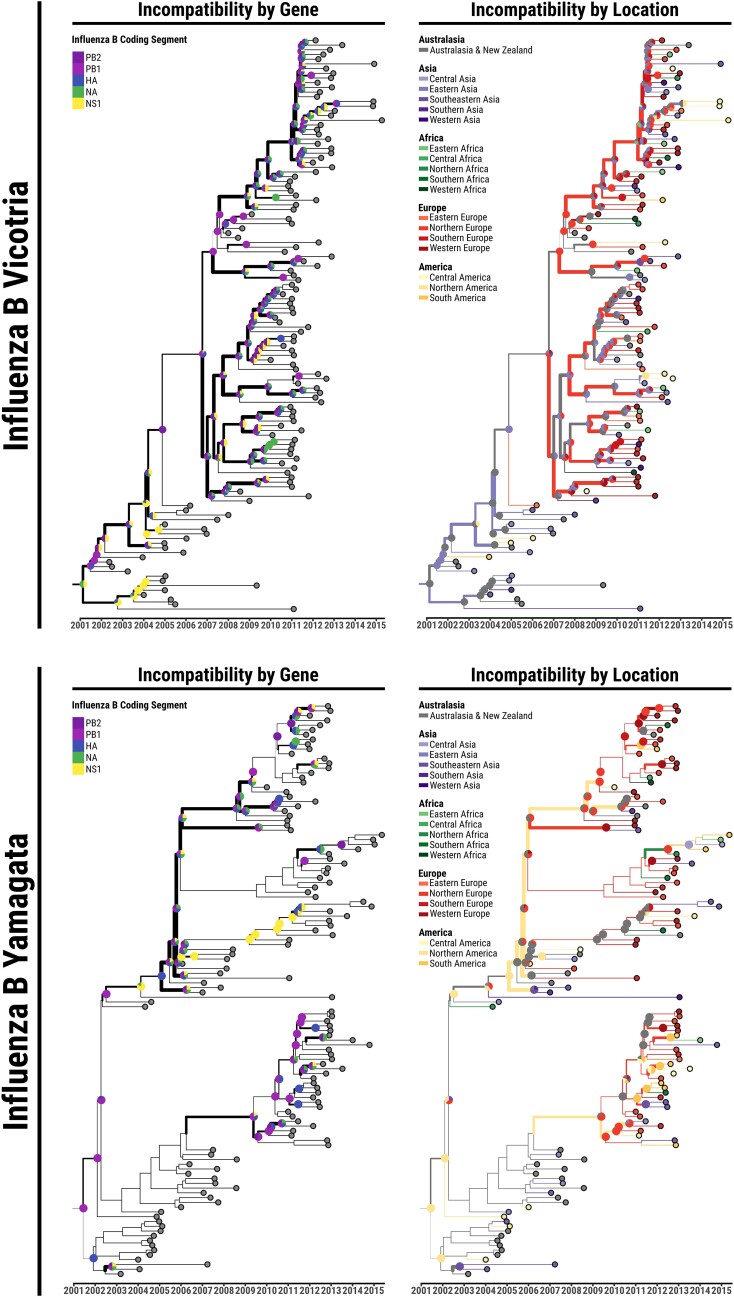
Fig. 6.
Illustration of the incompatibilities along the MCC tree for the Influenza B Victoria and Yamagata lineages epidemics. The line-width of each branch represents the total amount of phylogeographic MRCA incompatibilities between all trees built from individual genomic regions and the whole-genome tree. Pie charts represent the distribution of MRCA incompatibilities per genomic region (left) and per UN geographic region (right) on the corresponding nodes. Branch colors on the right topology represent the phylogeography reconstructed from the joint sequences alignment of all the genes investigated ( kb).

