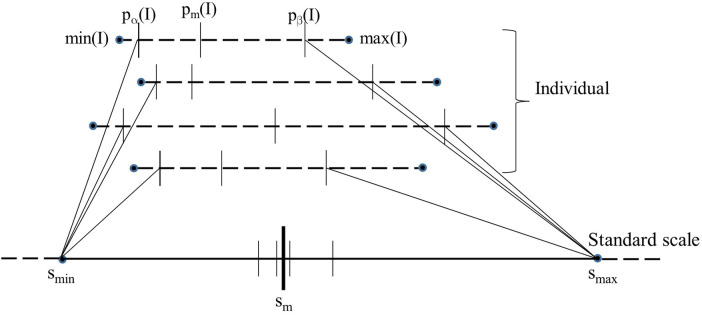
Figure 1.
Schematic illustration of the calibration process. The image intensity scales of 4 images are shown on the top as dotted lines. The 5 key landmarks of each image are also marked on the intensity scale. The standard scale is shown at the bottom as a solid line. The position of pm(I) when each of the 4 images is mapped linearly from their respective [pα(I), pβ(I) to [smin, smax] of the standard scale is depicted on the standard scale as small vertical.

