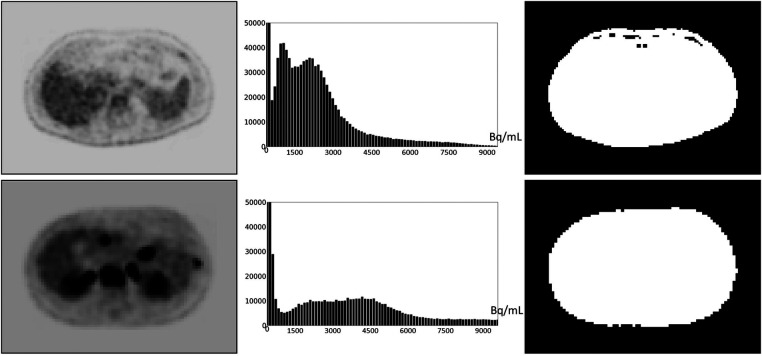
Figure 2.
An FDG-PET axial image slice at the mid abdominal level selected from a 3D body torso image I (left), the histogram of the full 3D image I (middle), and the binary image (right) resulting from thresholding I at mean(I). (Top): Image from a normal subject. (Bottom): Image from a patient with metastatic cancer. For better visualization, some background regions are trimmed in the slice displays on the left.

