Figure 5.

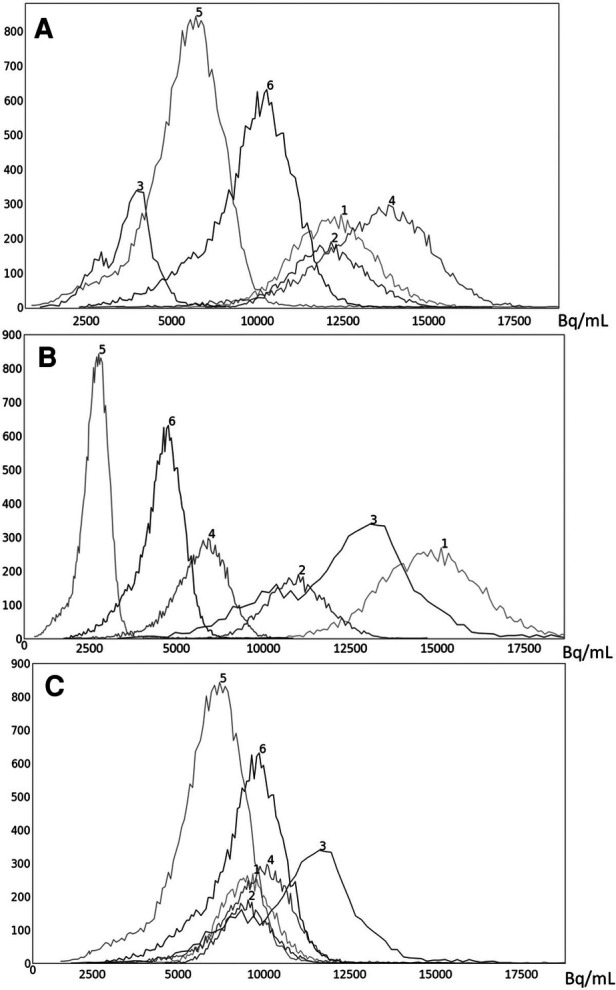
Histograms of liver 3D AC PET images of 6 subjects randomly chosen from the PET data set n: (A) original AC PET image; (B) AC PET image scaled by linear mapping guided by the maximum value; (C) s-AC.

Histograms of liver 3D AC PET images of 6 subjects randomly chosen from the PET data set n: (A) original AC PET image; (B) AC PET image scaled by linear mapping guided by the maximum value; (C) s-AC.