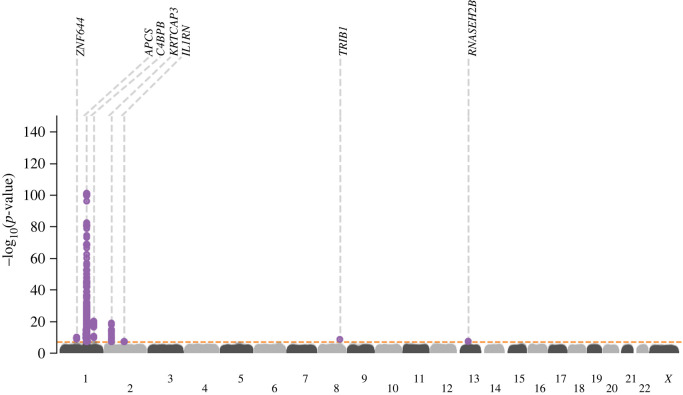
Figure 1.
Manhattan plot of SAP genome-wide association study. The −log10(p-value) of genetic variants is shown on the y-axis and GRCh37 base pair position within chromosomes on the x-axis. The horizontal dashed line is at p-value 5.8 × 10⁻⁸. The lead variants are labelled with the putative causal genes assigned by V2G.

