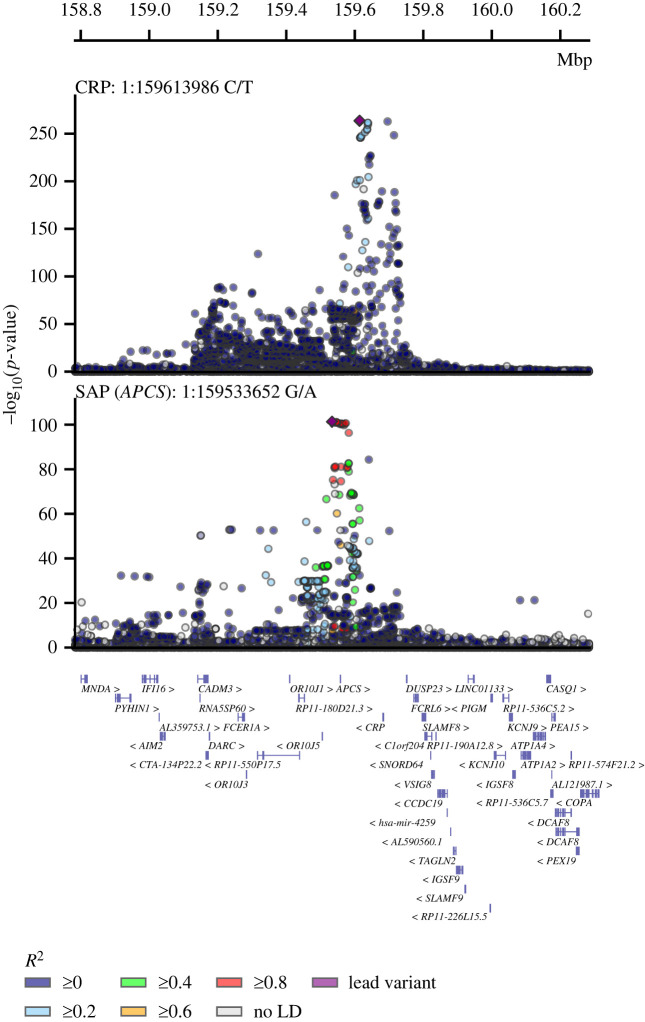
Figure 2.
Stacked locus-view comparing the overlap between genetic variants for plasma SAP values and plasma CRP concentration. The −log10(p-value) of the genetic association with SAP and CRP plotted (y-axis) against the genomic location (x-axis). The lead variant for each trait is indicated by a purple diamond. Linkage disequilibrium with the lead variant is indicated by coloured dots, with the R2 estimated from the UKB and 1000 genomes EUR reference. Gene locations were queried from Ensembl v109 (GRCh37).

