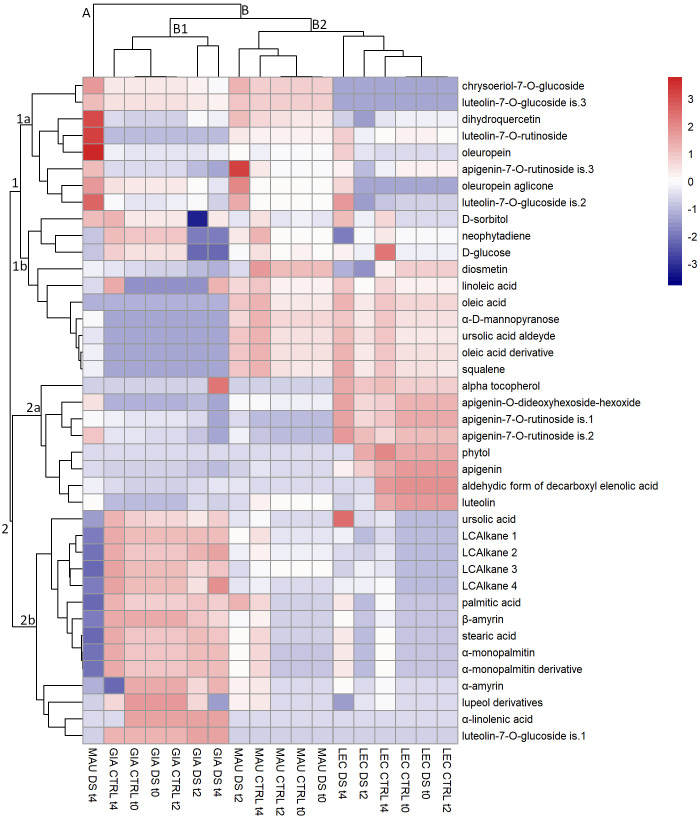
Figure 1.
Heat map of metabolites extracted from the leaves of olive cultivars Giarraffa (GIA), Leccino (LEC) and Maurino (MAU) irrigated (CTRL) or exposed to drought (DS). Samples were taken at the beginning of the drought stress (t0) and two (t2) and four (t4) weeks after the start of water deprivation. Hierarchical clustering is shown for both metabolites (left) and experimental groups (top). The red and blue colors correspond to higher and lower relative metabolite amounts normalized according to Z-score.

