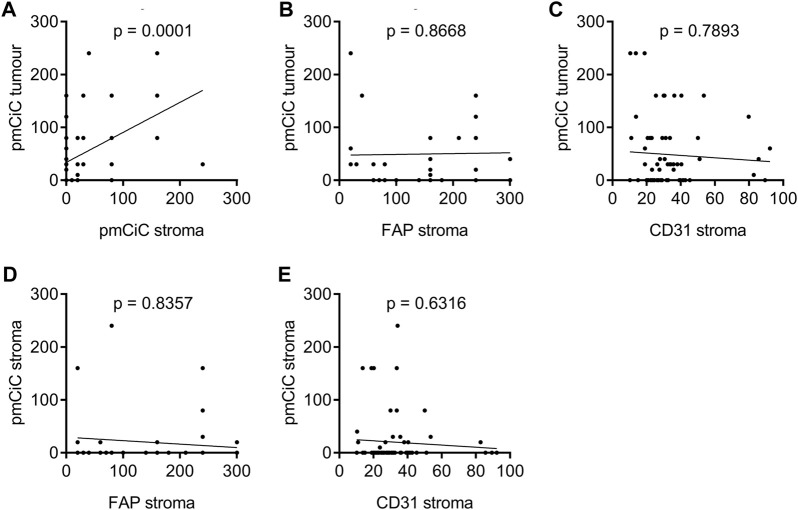
FIGURE 3.
Spearman’s rank correlation coefficient analysis of pmCiC expression in cancer cells of primary tumours or in the surrounding tumour stroma, and FAP and CD31 in the surrounding tumour stroma analysed by immunohistochemistry. Correlation of pmCiC expression in cancer cells in tumour tissue and (A) pmCiC expression in the surrounding tumour stroma (N = 73), and (B) FAP expression (N = 40), and (C) CD31 expression (N = 68). Correlation of pmCiC expression in the primary tumour stroma and (D) FAP expression (N = 39), and (E) CD31 expression (N = 67). Expression of pmCiC and FAP is presented as Score 300. Expression of CD31 is presented as number of positive vessels (mean value).

