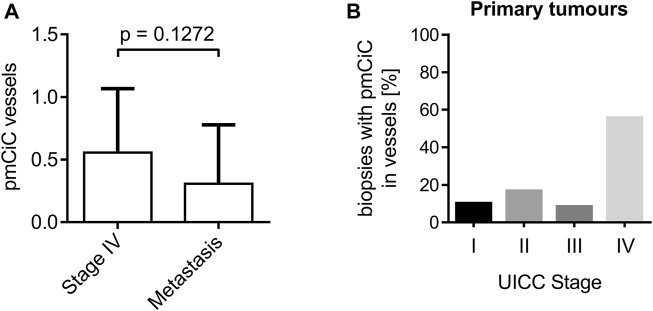
FIGURE 4.
Analysis of pmCiC expression in blood vessels. (A) Analysis of pmCiC expression in vessels of stage IV tumours compared with metastasis. N = 44 (18 stage IV tumours, 26 metastasis). The p value was calculated using the Mann-Whitney test. The graph shows the mean with standard deviation. (B) Percentage of biopsies with pmCiC staining in blood vessels subdivided by tumour stage.

