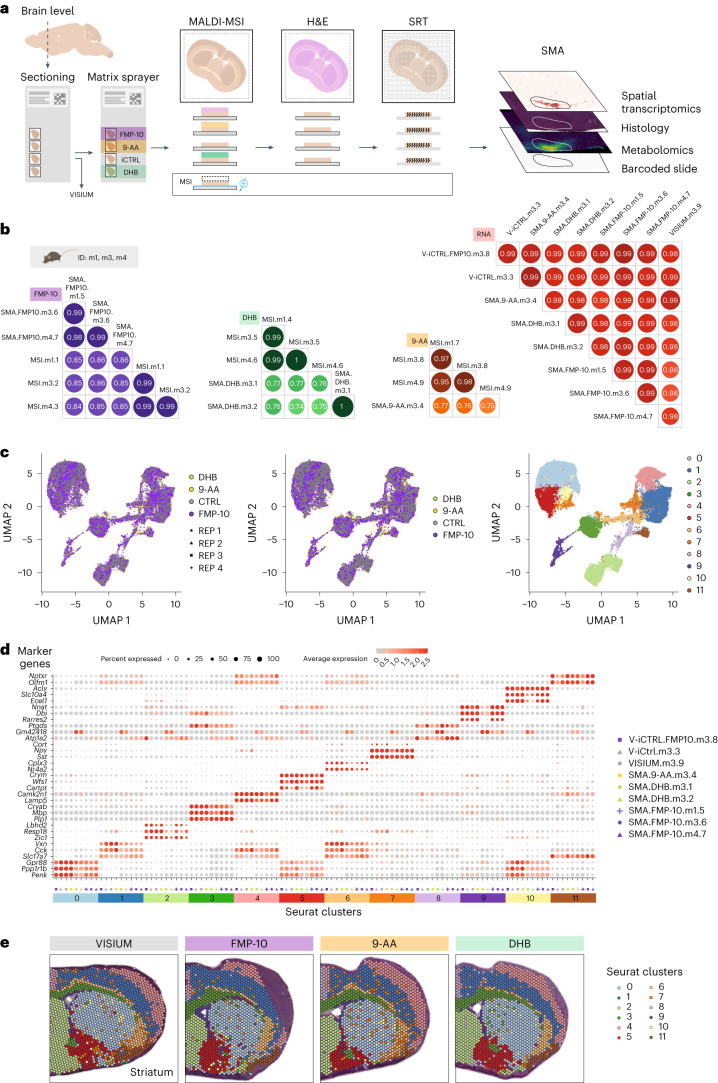
Fig. 1. A multimodal spatial omics approach to investigate metabolites, morphology and gene expression analysis.
a, The SMA workflow and quality control design—nonembedded, snap-frozen samples are sectioned and thaw-mounted onto noncharged, barcoded Visium Gene Expression arrays. Tissue sections are then sprayed with MALDI matrices and MSI is performed. This is followed by H&E staining and imaging with bright field microscopy. Finally, sections are processed for SRT. We also designed the following three types of control samples: (1) MSI—samples processed with standard MALDI-MSI protocol on ITO conductive slides; (2) VISIUM—samples processed with standard Visium protocol on all four capture areas of a Visium Gene Expression array and (3) V-iCTRL—samples processed with Visium protocol, but MALDI-MSI was performed on other capture areas of a Visium Gene Expression array. b, Pairwise gene-to-gene and molecule-to-molecule correlations across biological replicates. Samples are named with short identifiers that reflect the technical conditions under which the sample was analyzed: MSI, stand-alone MALDI-MSI; SMA, SMA protocol; VISIUM, stand-alone Visium. Additional acronyms indicate the matrix used in the SMA protocol (FMP-10, DHB and 9-AA), the sample (m1, m3 or m4) and the serial number of the tissue section (one to nine for each section placed on either ITO or Visium slides). c, UMAP of SMA ST spots colored by sections (left), MALDI matrices (middle) and clusters (right). d, Top three marker genes with highest average log2 fold change for each spatial cluster across biological replicates. e, Spatial plot of mouse brain tissue sections (striatal level, 0.49 mm from bregma) that illustrates clusters of transcripts for samples sprayed with three different MALDI matrices (FMP-10, 9-AA and DHB) and one sample processed with the stand-alone Visium protocol.

