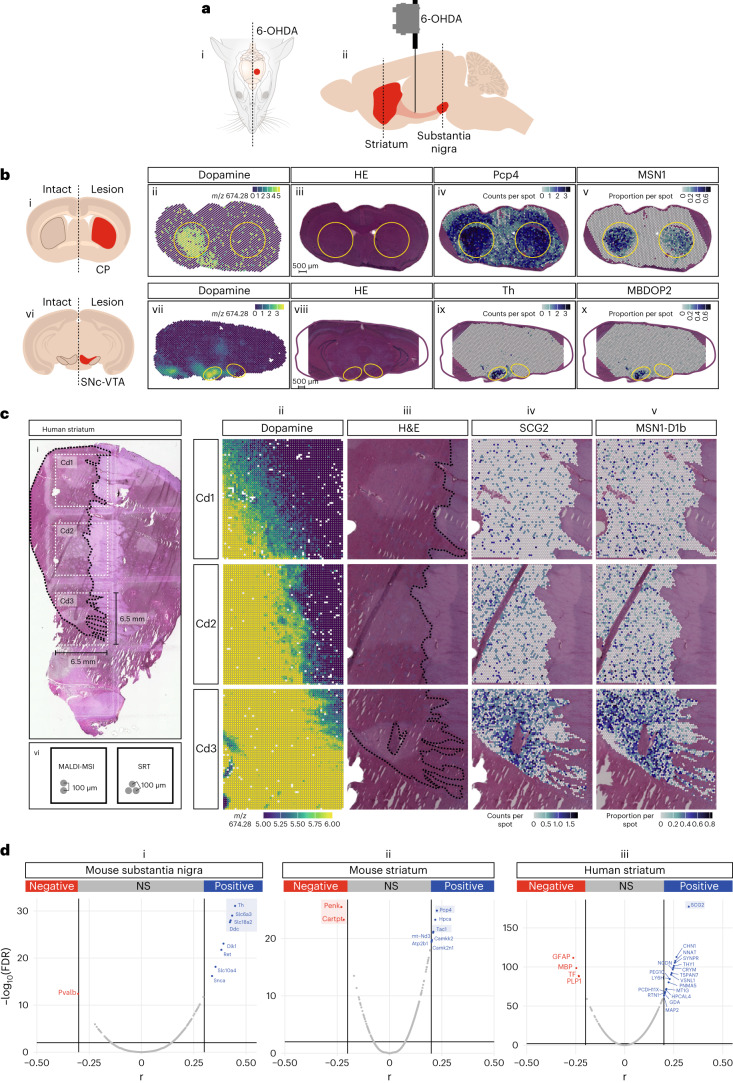
Fig. 2. Spatial multimodal analysis of a Parkinson’s disease mouse model and a human postmortem brain affected by Parkinson’s disease.
a, Cartoon showing the injection of 6-OHDA only in one hemisphere in the MFB. Dashed lines indicate the depth (0.49 and −3.39 mm, distance from bregma) for the substantia nigra and striatum, respectively. b, Representative sections from the substantia nigra and striatum of the mouse PD model. From left to right: cartoon showing the dopamine-depleted regions (i and vi), dopamine expression (ii and vii), H&E staining (iii and viii), spatial gene expression of the gene with the highest correlation to dopamine (iv and ix), proportions of MSN1 (v) and MBDOP2 (x). The remaining two striatal and two nigral sections processed with SMA and FMP-10 present in our dataset show similar results. c, Human postmortem striatum sample. From left to right: images are presented in the same order as in b. The demarcated area indicates the caudate nucleus of the striatum. See Fig. 2 for gene counts statistics. d, From left to right (i, ii and iii): dopamine-to-gene correlations in the mouse substantia nigra, mouse striatum and human striatum. Cd, caudate nucleus; CP, caudoputamen; NS, not significant.

