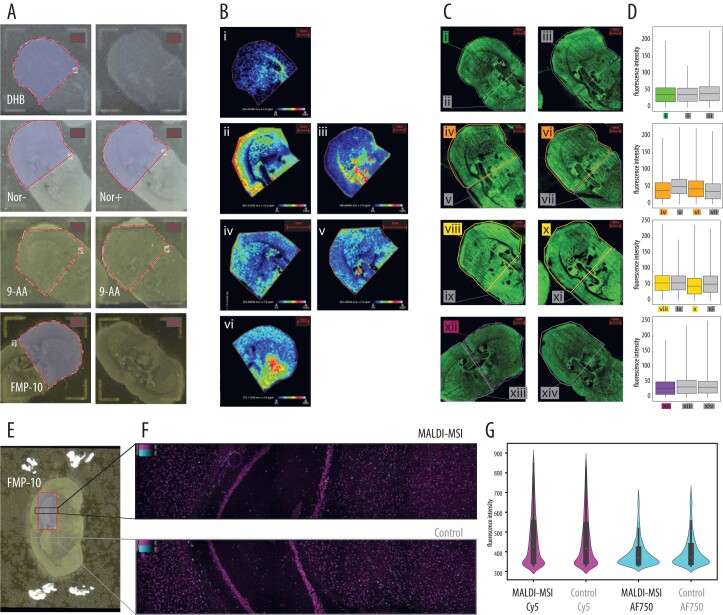
Extended Data Fig. 1. SMA using four different MALDI matrices.
(a) Eight mouse brain tissue sections from the striatal level of the same animal (n = 8) were mounted onto a Visium Tissue Optimization slide and sprayed with four different MALDI matrices (DHB, norharmane (analyzed in both positive and negative mode, shown as Nor+ and Nor-), 9-AA and FMP-10). Areas delimited by red lines: regions of interest imaged with MALDI-MSI. Scalebars: 1 mm. (b) Representative MSI results from: i) m/z 426.36, C18:1 L-Carnitine (DHB); ii) m/z 857.52, PI(36:4) (Nor-); iii) m/z 788.62 PC(36:1) (Nor+); iv,v) m/z 303.24, arachidonic acid (9-AA); vi) m/z 371.17, GABA (FMP-10). Nor+ and Nor-: Norharmane analyzed in positive and negative mode, respectively. Scalebars: 1 mm, except iv and v where it is 2 mm. (c) Fluorescence microscopy images of mRNA footprint captured with polydT probes after MALDI-MSI. Colored lines (i, iv, vi, viii, x, xii) demarcate areas imaged with MALDI-MSI, while gray lines (ii, iii, v, vii, ix, xi, xiii, xiv) demarcate areas not imaged with MALDI-MSI and used as controls. Scalebars: 1 mm. (d) Fluorescence intensity of tissue areas imaged or not with MALDI-MSI. The upper and lower limit of the box represent the +1 and −1 standard deviation from the mean, the horizontal line inside the box represents the mean fluorescence intensity, and the upper and lower limits of the whiskers represent the maximum and minimum fluorescence intensity values. The results shown in panels (A-C) belong to eight consecutive tissue sections from n = 1 biologically independent sample examined over one independent experiment (all the sections were placed on one Visium Tissue Optimization array). The areas in square pixels over which the statistics is derived are the following: i = 768047, ii=355349, iii=843707, iv=866085, v = 578711, vi=805789, vii=562179, viii=846042, ix=317398, x = 843416, xi=611982, xii=779667, xiii=727089, xiv=751797. (e) A mouse brain tissue sections (n = 1) from the hippocampus level was mounted onto an ITO slide and sprayed FMP-10. The area delimited by a red line demarcates the region of interest imaged with MALDI-MSI. (f) Targeted In Situ Sequencing data demonstrate similar rolling circle product (RCP) density generated from MALDI-MSI processed region (upper right panel) and non-processed region (lower right panel) for demarcated regions of interest in the mouse coronal section (n = 1). Targeted ISS simultaneously probed for housekeeping gene, Gapdh labeled in Magenta (Cy5), and a panel of five control genes - Foxj1, Plp1, Lamp5, Rorb and Kcnip2 that are labeled in Cyan (AF750). (g) Mean Cy5 and AF750 fluorescence intensity of rolling circle products in tissue areas imaged or not with MALDI-MSI.The results shown in panels (E-G) belong to one tissue section from n = 1 biologically independent sample examined over one independent experiment. The number of RCPs detected in the MALDI-MSI processed region in AF750 and Cy5 and the number of RCPs detected in the non-processed region in AF750 and Cy5 respectively, which the statistics is derived from, are the following: n = 3830,n = 18231, n = 3051,n = 18193. The lower and upper hinges of the boxplot correspond to the first and third quartiles (the 25th and 75th percentiles), the central white dot corresponds to the median, the upper and lower whiskers extend from the hinge to the maximum or minimum respectively.

