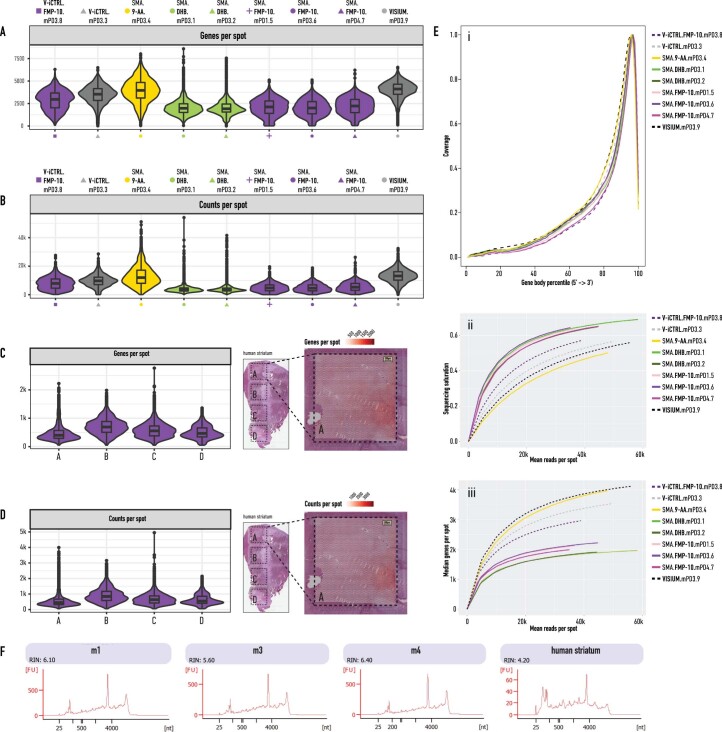
Extended Data Fig. 2. Spatial transcriptomics data quality control.
Violin plots and box plots illustrating the number of unique genes per spot (a) and the number of unique molecular identifiers (UMIs) per spot (b) across biological conditions of the mouse striatum data (n = 9). The numbers of spots per section from which the statistics is derived are the same for the corresponding sections in panels A and B, and are the following: V-iCTRL.FMP10.mPD3.8 = 3017, V-iCTRL.nM.mPD3.3 = 3163, SMA.9AA.mPD3.4 = 2913, SMA.DHB.mPD3.1 = 2856, SMA.DHB.mPD3.2 = 3002, SMA.FMP10.mPD1.5 = 2675, SMA.FMP10.mPD3.6 = 3120, SMA.FMP10.mPD4.7 = 2918, VISIUM.mPD3.9 = 3116. n = 9 sections examined over 3 biologically independent samples. Violin plots and box plots illustrating the number of unique genes per spot (c) and the number of unique molecular identifiers (UMIs) per spot (d) of the human striatum data (n = 1). The human sample H&E was used as a legend to indicate the four capture areas A-D. The numbers of spots per capture area from which the statistics is derived are the same for corresponding sections in panels C and D and are the following: A = 4770, B = 4875, C = 4740, D = 4387. n = 4 capture areas examined over 1 biologically independent sample. For all boxplots presented in (A-D) the lower and upper hinges of the boxplot correspond to the first and third quartiles (the 25th and 75th percentiles), the central line corresponds to the median, the upper and lower whiskers extend from the hinge to the largest or smallest value respectively no further than 1.5 times the inter-quartile range, data beyond the end of the whiskers are plotted individually as black dots. On the right, spatial featureplot representing the number of genes per spot and the number of UMIs per spot of a representative capture area (that is, capture area A). (e) Sequencing metrics: i) Gene body coverage plot illustrating the sequencing coverage at different percentiles of gene body for all the genes in the quality control dataset; ii) sequencing saturation as a function of mean reads per spot; iii) median genes per spot as a function of mean reads per spot. (f) RNA integrity plots of mouse and human post-mortem samples.

