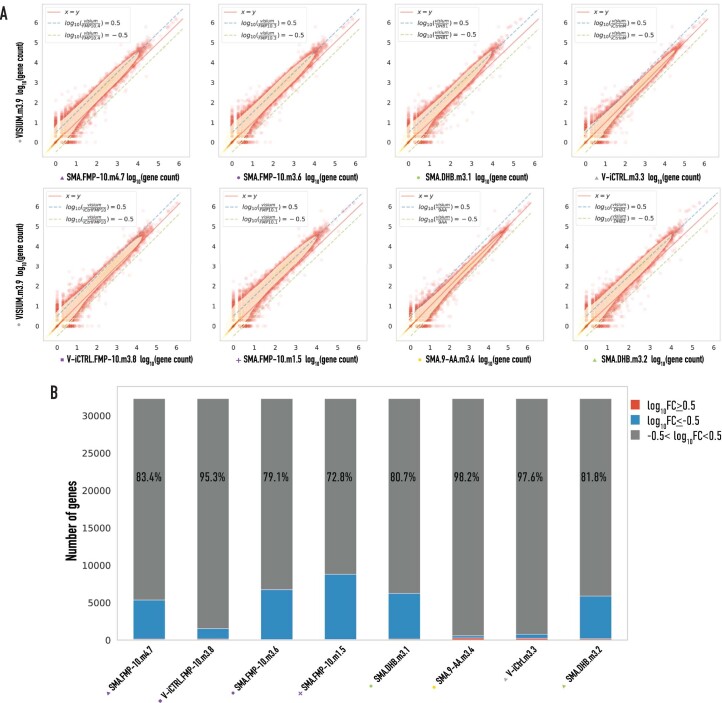
Extended Data Fig. 3. Performance analysis of SMA-SRT data.
(a) Scatterplots of log10 gene counts of SMA-SRT data vs. stand-alone Visium data. The red line highlights a 1-to-1 relationship, whereas the dashed green and blue lines highlight a log10 0.5 or −0.5 relationship. (b) Stacked barplot illustrating the percentage of genes with log10 higher, lower or within the log10 fold change range −0.5-0.5. The percentages inside the gray bars illustrate the percentages of peaks with absolute log10 below 0.5.

