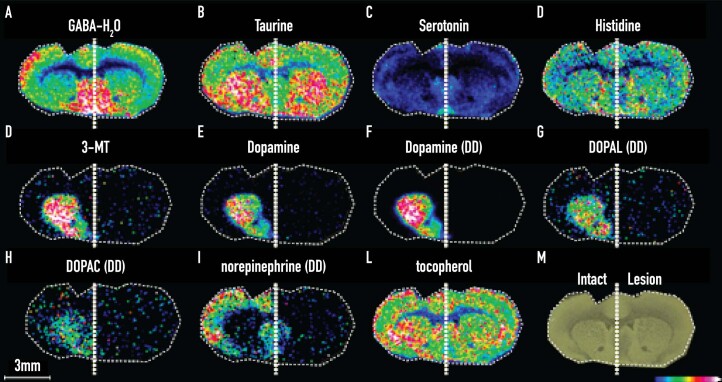
Extended Data Fig. 5. Selection of ion images from key neurotransmitters and metabolites in coronal tissue sections from a mouse PD model.
Ion distribution images of (a) GABA-H2O, (b) taurine, (c) serotonin, (d) histidine, (e) 3-MT, (f) dopamine, (g) dopamine, double derivatized (DD), (h) DOPAL (DD), (i) DOPAC (DD), (j) norepinephrine (DD), (k) tocopherol, and (l) scanned image of the coronal mouse tissue section that was analyzed. All ion distribution images are scaled to 50% of max intensity and presented as single derivatized species, unless otherwise stated.

