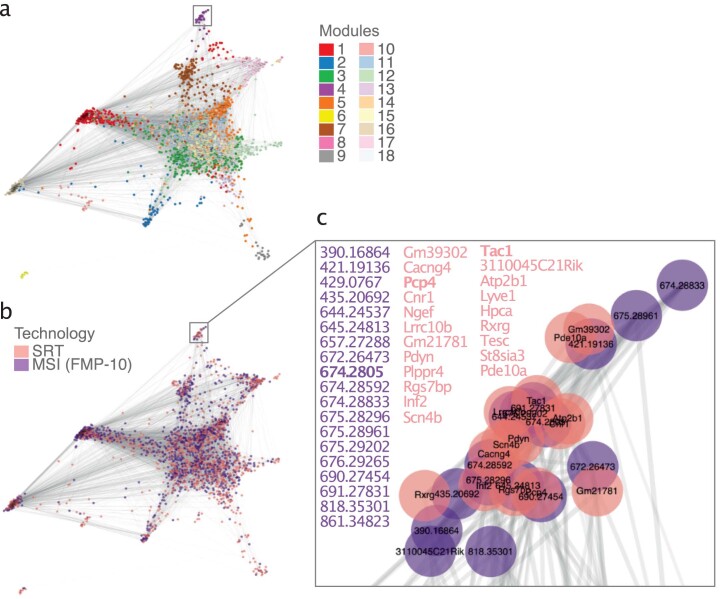
Extended Data Fig. 7. Joint embedding of gene and FMP-10 MSI peaks.
Force directed layout of 10K-nearest neighbors was run on cosine distance graph (represented by edge thickness and shade). Nodes (genes and peaks) were split in 18 spatially co-detected modules using the Spinglass algorithm (a) and by technology of origin (b). Genes and peaks whose expression were associated with dopamine (m/z 674.2805) were enriched in module 4 and shown in (c).

