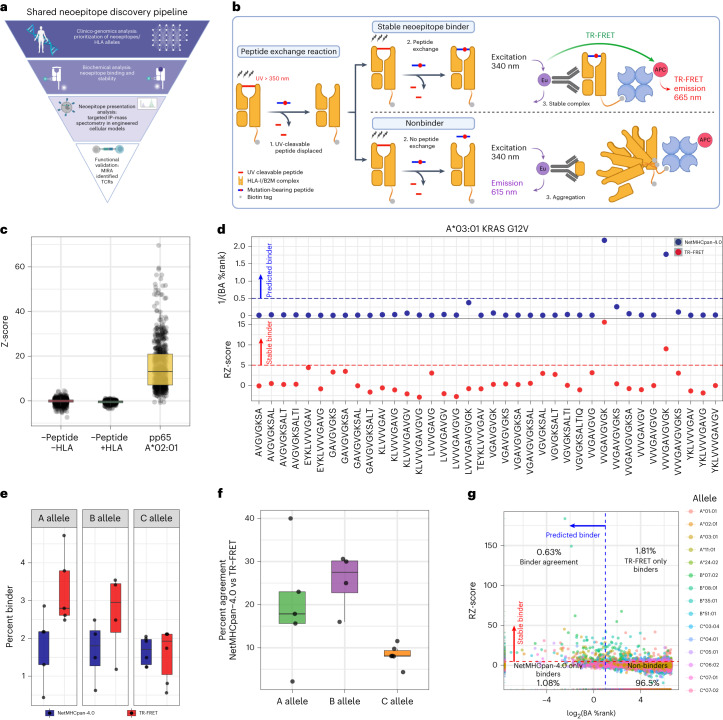
Fig. 1. A shared neoepitope discovery pipeline featuring characterization of neoepitope–HLA binding through a high-throughput TR-FRET assay and NetMHCpan-4.0 prediction.
a, Overview of the shared neoepitope discovery pipeline. b, Schematic diagram of the TR-FRET assay used to measure stable neoepitope–HLA binding. In brief, HLA monomers bound to UV-cleavable peptides are exposed to UV light in the presence of mutation-bearing candidate neoepitopes. Successful exchange of the candidate peptide will lead to complex stabilization and TR-FRET emission (top). Unsuccessful exchange will lead to aggregation and no TR-FRET emission (bottom). c, TR-FRET data for all controls measured within the screen. Z-score was calculated as compared to −Peptide/+HLA controls for each 384-well plate. The box represents the interquartile range; the line represents the median value; and the whiskers represent the minimum and maximum values (excluding outliers). Each dot represents an individual well measurement (−Pep,−HLA n = 1,477; −Pep,+HLA n = 368; pp65,+A*02:01 n = 623). d, Representative TR-FRET results for KRAS G12V/A*03:01 comparing NetMHC BA percentile rank (%Rank, blue) and RZ-score (red). e, Percent of neoepitope–HLA combinations that were determined to be stable binders by TR-FRET (red) or NetMHC (blue) across the HLA A, B and C alleles. The box represents the interquartile range; the line represents the median value; and the whiskers represent the minimum and maximum values (excluding outliers). Each dot represents the count of binders for a single allele (A allele,NetMHC n = 5; A allele,TR-FRET n = 5; B allele,NetMHC n = 4; B allele,TR-FRET n = 4; C allele,NetMHC n = 6; C allele,TR-FRET n = 6). f, Percent of neoepitope–HLA pairs found to be binders by NetMHC and/or TR-FRET across the A (green), B (purple) and C (orange) alleles, with each dot representing a single allele. The box represents the interquartile range; the line represents the median value; and the whiskers represent the minimum and maximum values (excluding outliers). Each dot represents the percent agreement for each allele (A allele n = 5, B allele n = 4, C allele n = 6). g, Scatter plot of TR-FRET RZ-score and NetMHC BA %Rank. The dashed red line represents the cutoff for stable binders as measured by TR-FRET, where values higher than the red line are considered a stable binder. The dashed blue line represents the cutoff for binders based on NetMHC analysis, where values lower than the blue line are considered binders. a and b were created with BioRender.com.

