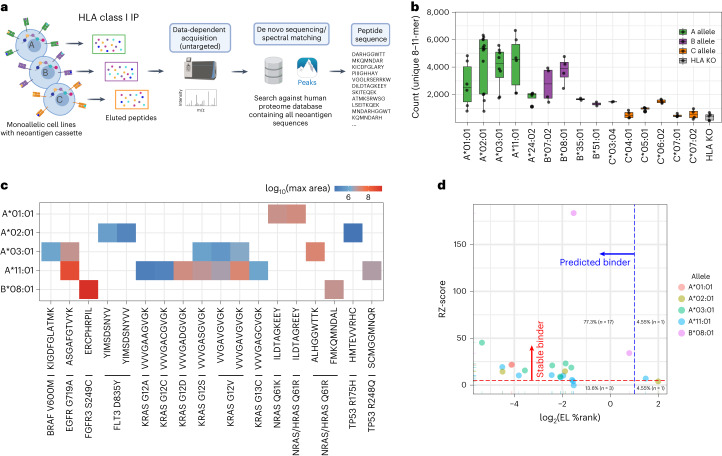
Fig. 3. Untargeted immunopeptidomic analysis of monoallelic cell lines expressing the polyantigen cassette.
a, Workflow for untargeted immunopeptidomic analysis of monoallelic cell lines containing the polyantigen cassette. b, Number of unique 8–11-mer peptides identified in untargeted immunopeptidomic analysis. The box represents the interquartile range; the line represents the median value; and the whiskers represent the minimum and maximum values (excluding outliers). Each dot represents a separate analysis beginning with a replicate cell pellet (A*01:01 n = 6, A*02:01 n = 13, A*03:01 n = 8, A*11:01 n = 6, A*24:02 n = 4, B*07:02 n = 4, B*08:01 n = 4, B*35:01 n = 2, B*51:01 n = 2, C*03:04 n = 2, C*04:01 n = 4, C*05:01 n = 4, C*06:02 n = 4, C*07:01 n = 4, C*07:02 n = 4, HLAKO n = 5). c, Identified shared cancer neoantigen epitopes. The color scale represents the log10 largest area across all analyses. d, Comparison of TR-FRET RZ-score and NetMHC EL percentile rank (%Rank) score for each epitope identified through untargeted immunopeptidome analysis. a was created with BioRender.com.

