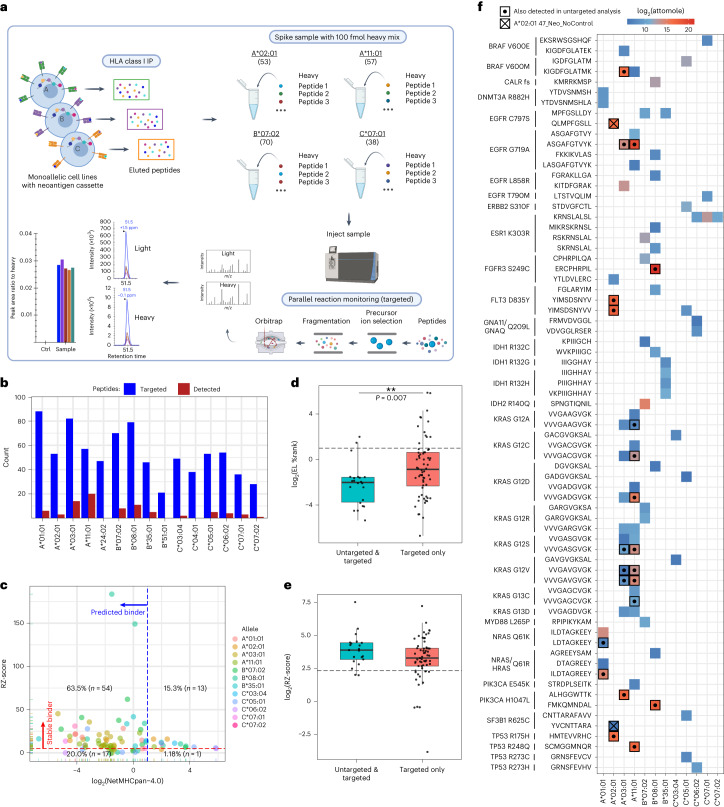
Fig. 4. Targeted immunopeptidomic analysis of monoallelic cell lines expressing a polyantigen cassette.
a, Targeted immunopeptidomic workflow for the analysis of candidate neoepitopes within monoallelic cell lines expressing a polyantigen cassette. b, The number of targeted (blue) and detected (red) shared cancer neoantigen epitopes within each targeted assay. c, Comparison of TR-FRET RZ-score and NetMHC EL %Rank score for each epitope identified through targeted immunopeptidome analysis. d, NetMHC EL %Rank scores for neoepitopes detected in both untargeted and targeted (teal) analysis or targeted analysis alone (red). The box represents the interquartile range; the line represents the median value; and the whiskers represent the minimum and maximum values (excluding outliers). Each dot represents a neoepitope–HLA pair (untargeted & targeted n = 22, targeted only n = 64). The P value was calculated using a Wilcoxon test (two-sided). e, Same analysis as d but for TR-FRET RZ-scores. f, Summary of neoepitope–HLA pairs detected from shared cancer neoantigens. Color represents attomol of neoepitopes detected on column during analysis. Bolded squares with centered dots represent neoepitopes also detected in untargeted analysis. A square with an ‘X’ indicates A*02:01-specific neoepitopes that were detected in a cell line containing a polyantigen construct lacking control neoantigen sequences. a was created with BioRender.com.

