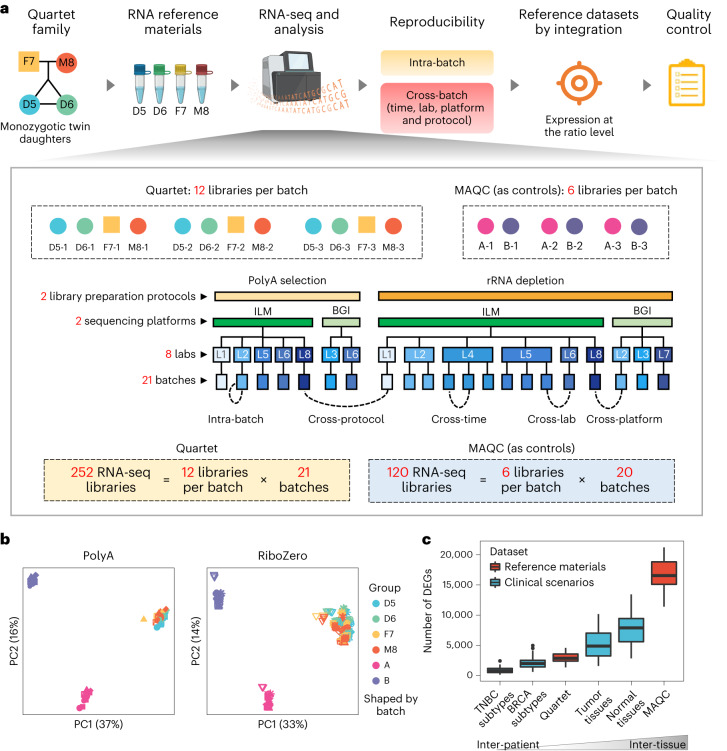
Fig. 1. Overview of study design.
a, Quartet RNA reference materials were derived from immortalized EBV-infected B-LCLs from a quartet family, including monozygotic twin daughters (D5 and D6) and their father (F7) and mother (M8). Multi-batches of RNA-seq datasets were generated from independent laboratories using different library preparation protocols and sequencing platforms. Intra-batch proficiency and cross-batch reproducibility were then estimated. Based on multi-batches of RNA-seq data, we constructed ratio-based transcriptome-wide reference datasets and developed corresponding quality metrics. b, Scatter plots of PCs on RNA-seq data of the Quartet and MAQC RNA reference materials (marked in colors) across 20 batches (marked in shapes; see Supplementary Fig. 4 for details). log2-transformed FPKM values were used for PCA. c, Box plots showing the numbers of DEGs among Quartet reference materials, MAQC reference materials and four clinical/biological classification problems from published datasets. The four clinical/biological classifications used to represent clinical scenarios include four subtypes of TNBCs with different therapeutic actions (basal-like and immune-suppressed, luminal androgen receptor, immunomodulatory subtype and mesenchymal-like subtypes)34, four subtypes of breast cancers (BRCAs) with different prognosis and therapeutic actions (luminal A, luminal B, basal-like/triple negative and HER2-positive subtypes)35, four types of tumor tissues (brain, breast, kidney and lung cancers)35 and four types of normal tissues (brain, breast, kidney and lung)36. The latter two types of biological classification problems are important for understanding the genetic basis of human diseases. Three samples from each clinical subtype or biological group were randomly selected for differential expression analysis to eliminate effect of number of samples used for analysis. A gene was identified as differentially expressed when satisfying the criteria of Student’s t-test two-sided P < 0.05 and fold change ≥2 or ≤0.5 between two groups or conditions. To eliminate selection biases, this process was repeated 20 times (n = 20). The box plots display the distribution of data with the median represented by the line inside the box and the interquartile range represented by the box. The whiskers extend from the box to the minimum and maximum values that are not outliers.

