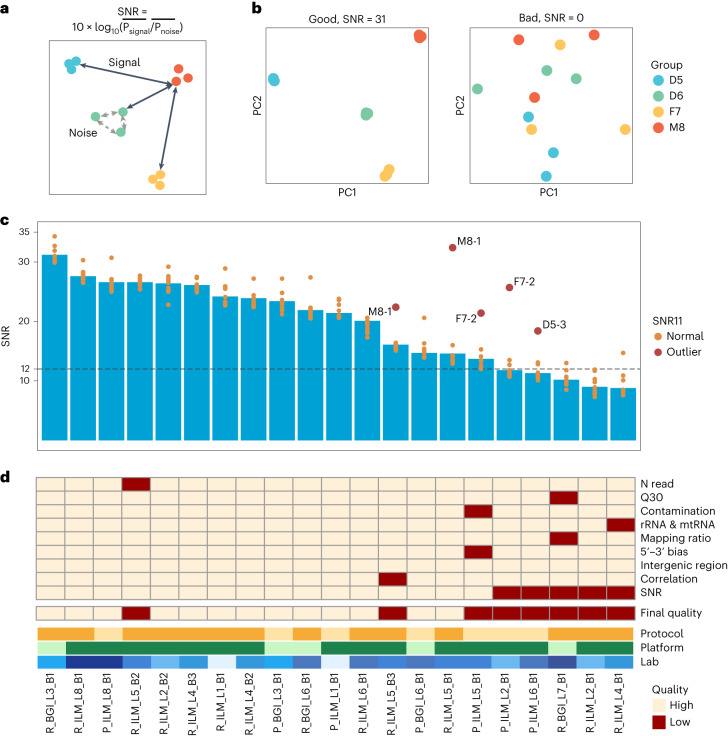
Fig. 2. SNR enables assessment and diagnosis of data quality.
a, Concept of calculating SNR. SNR was established to characterize the ability of a platform, a laboratory or a batch to distinguish the intrinsic differences among distinct biological sample groups (‘signal’) from variations in technical replicates of the same sample group (‘noise’). b, Examples of good and bad batches with their SNR values and corresponding PCA scatter plots. c, SNR values across 21 RNA-seq batches to measure data quality. Batches were ordered by SNR values. Dots represent SNR values based on any 11 of the 12 libraries (SNR11) in each batch. A dot in dark red represents SNR11 value that increased over 6 dB compared to its standard SNR (12-sample SNR), when one library in this batch was excluded (the library ID was labeled), whereas a dot in orange represents SNR11 value that decreased or increased less than 6 dB compared to its standard SNR. d, Quality flags of RNA-seq batches in terms of the number of sequencing reads (N read), percentage of Q30 (Q30), percentage of reads that were mapped to contamination species (for example, virus, bacteria and fungi) (Contamination), percentage of reads that were mapped to rRNA or mtRNA (rRNA & mtRNA), percentage of reads that were mapped to the human genome (Mapping ratio), gene body (5′–3′) bias (5′–3′ bias), percentage of mapped reads that were located in intergenic region in human genome (Intergenic region), Pearson correlation coefficient of technical replicates (Correlation), SNR and Final quality flag. Batches were ordered by SNR values. Protocol, Platform and Lab information of each batch is shown by the color legend.

