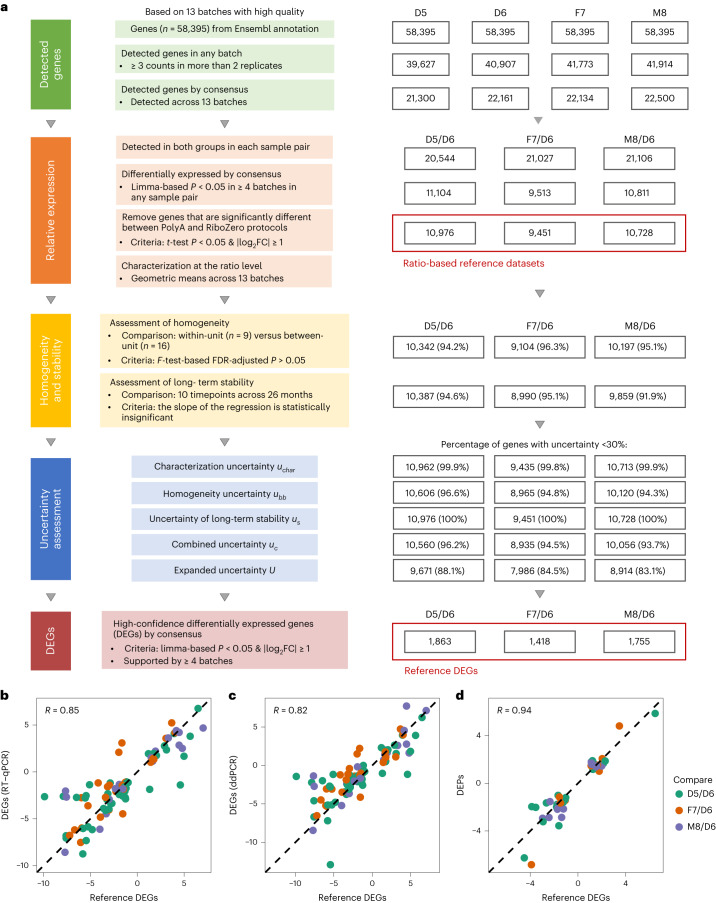
Fig. 3. Construction and validation of ratio-based transcriptome-wide reference datasets.
a, Workflow for constructing Quartet RNA reference datasets. Reference datasets were constructed according to the following steps: (1) identifying detectable genes; (2) calculating ratio-based expression based on reliably detectable genes that were differentially expressed; (3) assessing the homogeneity and stability of RNA reference materials; (4) assessing the uncertainty of ratio-based reference datasets; and (5) identifying high-confidence DEGs. b–d, Scatter plots of log2 fold changes (FCs) of gene expression between reference DEGs and RT–qPCR (b), ddPCR (c) and proteomics data (d). Pearson correlation coefficient across three sample pairs was calculated. Genes/proteins that were considered as differentially expressed in both methods shown in x axis and y axis were used for plotting. x axis: average log2FC from 13 high-quality RNA-seq batches reference DEGs. y axis: for the RT–qPCR and proteomics data, a gene or a protein was considered as a DEG/DEP when the t-test two-sided P < 0.05 and FC ≥2 or ≤0.5; for ddPCR data, genes that were identified as DEGs based on RT–qPCR were used. Average log2FC of RT–qPCR (n = 3), ddPCR (n = 2) and proteomics (n = 3) data from DEGs/DEPs were used for plotting. DEP, differentially expressed protein.

