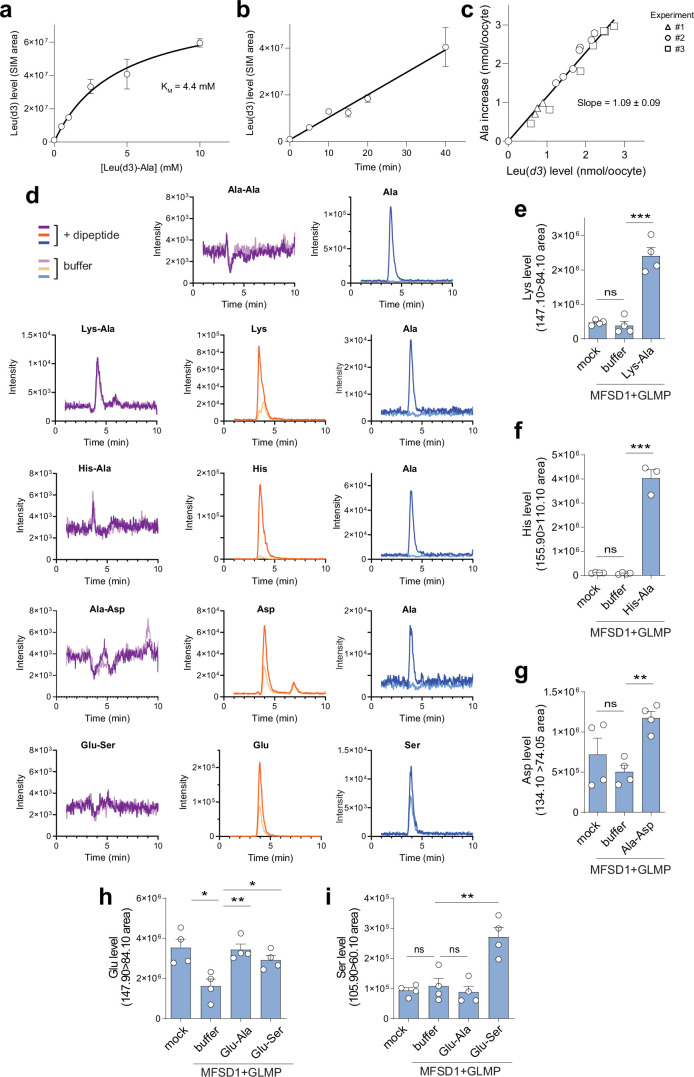
Extended Data Fig. 4. Additional evidence for Leu-Ala uptake by MFSD1 and Substrate selectivity of MFSD1/GLMP in the LC-MS/MS assay.
(a) Dose-response relationship of the accumulation of Leu(d3) in MFSD1/GLMP oocytes exposed to Leu(d3)-Ala (means ± SEM of 3 oocytes). The line shows a hyperbolic curve fit with a KM value of 4.4 mM (R2 = 0.989). (b) Time course of Leu(d3) accumulation in the presence of 10 mM Leu(d3)-Ala (means ± SEM of 3 oocytes). Linear regression R2 = 0.980. (c) Relationship between the accumulation of Leu(d3) and the increase of ‘light’ Ala over its endogenous level. Data shown in Fig. 5c were replotted to show the equimolar ratio between these two proxies of Leu(d3)-Ala uptake. Linear regression of the pooled data yielded a ratio of 1.15 Ala molecule co-released with each Leu(d3) molecule (R2 = 0.980), or a mean ratio of 1.09 ± 0.09 when the 3 experiments were analyzed separately. (d-i) Substrate selectivity of MFSD1/GLMP in the LC-MS/MS assay. (d) Representative LC-MS chromatograms of 6 to 8 oocytes per condition from 2 independent experiments. (e-i) Relative quantification of the chromatographic peak area of Lys, His, Asp, Glu, and Ser in extracts from mock and MFSD1/GLMP oocytes, incubated or not, with the indicated dipeptides (10 mM) for 23 min at pH 5.0. Data are means ± SEM; (e + g): n = 4 oocytes, (f): n = 3 oocytes from the same experiment. Two-tailed unpaired t-tests: ns = not significant; * p ≤ 0.05; ** ≤ 0.01; *** p ≤ 0.001. Source numerical data are available in source data.

