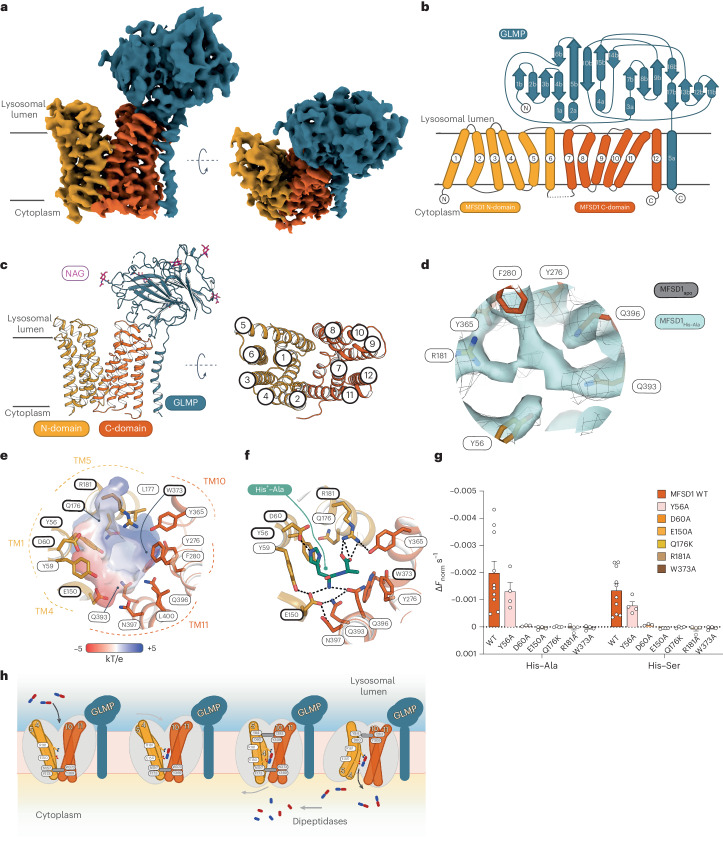
Fig. 6. The outward-open structure of GLMP–MFSD1.
a, Cryo-EM map of GLMP–MFSD1His–Ala. The N- and C-domain of MFSD1 are coloured yellow and orange, respectively. GLMP is coloured blue. b, Topology diagram of MFSD1 and GLMP. The N- and C-termini are labelled, and the secondary structure elements are numbered. c, Cartoon representation of GLMP–MFSD1 with top view of MFSD1. The numbering of TMs is indicated. Sugar modifications (acetylglucosamine (NAG)) identified on GLMP are coloured pink. d, Additional binding-site density was found for the GLMP–MFSD1 data set in the presence of the dipeptide with His–Ala (MFSD1His–Ala) compared with the apo dataset (MFSD1apo). The map of MFSD1His–Ala is shown as light blue surface and that of the apo dataset as grey mesh (light grey). Both the maps are depicted at σ = 6. The residues surrounding the extra density are labelled. e, The electrostatic surface potential (expressed as kT/e, with k, Boltzmann constant; T, temperature in K; and e, elementary charge), calculated with the APBS plugin in PyMol, highlights the bipolar character of the binding site. The residues that were mutated in this study are framed in bold black. f, Binding of the protonated dipeptide His+–Ala (green) as observed after 500 ns of MD simulations. Hydrogen bonds are indicated as dashed black lines, and residues used for mutational studies are framed in bold black. g, Effect of mutations of binding-site residues on uptake of His–Ala or His-Ser compared with MFSD1WT. The uptake rates are given as mean ± s.d. for n = 8 (MFSD1WT) or n = 4 (mutants) of independent experiments. h, A schematic of transport of dipeptides (blue (N-terminus) and red (C-terminus) sticks) by the GLMP–MFSD1 complex. The cytoplasmic gate formed by residues N157, F173, W373 and Y369 is shown (shown as a grey bar) as well as residues E150 and R118 involved in peptide coordination. The source numerical data are available in the source data.

