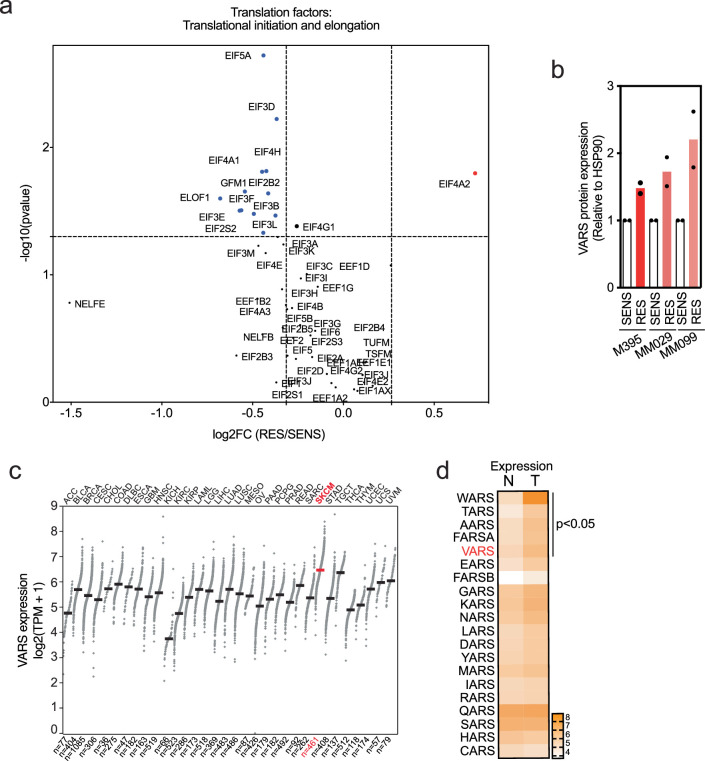
Extended Data Fig. 3. VARS expression correlates negatively with the survival of patients with melanoma.
a, Volcano plot representing translation factors (initiation and elongation) from M395 SENS and RES proteomics data. Significant changes (two-tailed unpaired t-test) are represented in red (upregulated genes) or in blue (downregulated genes). b, Quantification of VARS protein expression in M395, MM099 and MM029 SENS and RES cultures (Fold mean ± SEM of 2 independent replicates). c, VARS mRNA expression across cancers. TPM stands for transcripts per million. SKCM stands for skin cutaneous melanoma. d, TCGA analysis of all aminoacyl-tRNA synthetases expression in normal (N) and tumor (T) skin cutaneous melanoma. Pvalues were obtained from GEPIA.

