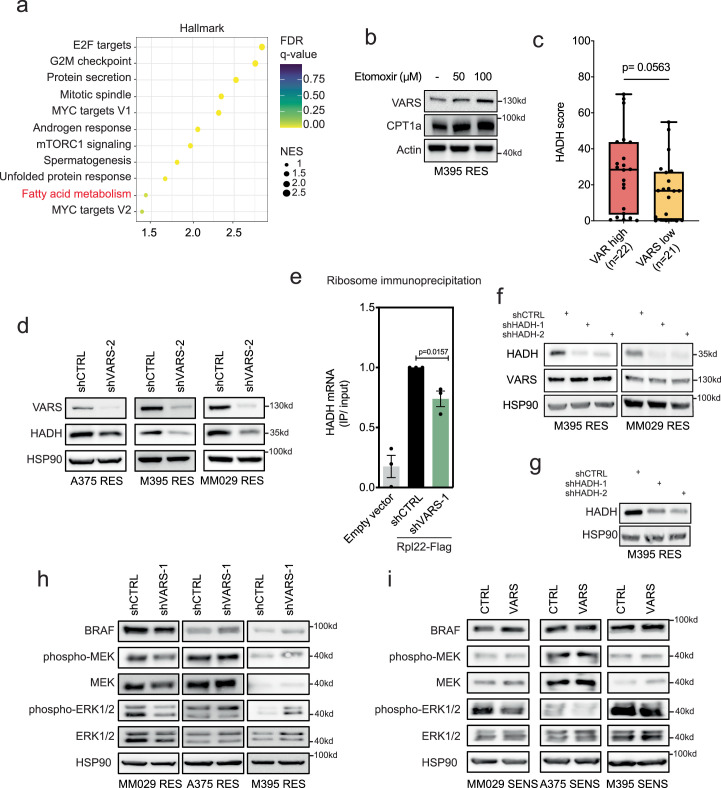
Extended Data Fig. 7. VARS correlates with HADH expression and VARS transcriptionally regulates HADH.
a, Dot plot of significantly enriched terms in VARS high versus VARS low TCGA melanomas using the hallmark database (GSEA). The color of the bubbles represents the FDR q-values and the size of the bubbles represents the enrichment scores (NES). b, Western blot analysis of M395 RES upon etomoxir treatment as indicated. CPT1a is used as a control (n = 3). c, HADH immunostaining score was represented for VARS high (n = 22) and VARS low patient (n = 21) groups in normal skin, primary and metastatic melanoma patient biopsies. Two-sided Mann-Whitney test was performed. Whiskers are represented as min to max values with a median line. d, Western blot of VARS and HADH protein expression in A375, M395, MM029 RES cells depleted or not of VARS (shVARS-2). e, qRT-PCR after ribosomal immunoprecipitation using RPL22-Flag expression cells depleted (shVARS) or not (shCTRL) of VARS. Fold mean ± SEM of n = 3 independent replicates, two-tailed unpaired t-test was performed. f, Western blot corresponding to Fig. 7i. g, Western blot corresponding to Fig. 7j (n = 3). h,i, Western blot showing MAPK pathway upon VARS depletion (h) or VARS overexpression (i) in MM029, A375 and M395 RES or SENS melanoma cells (n = 1).

