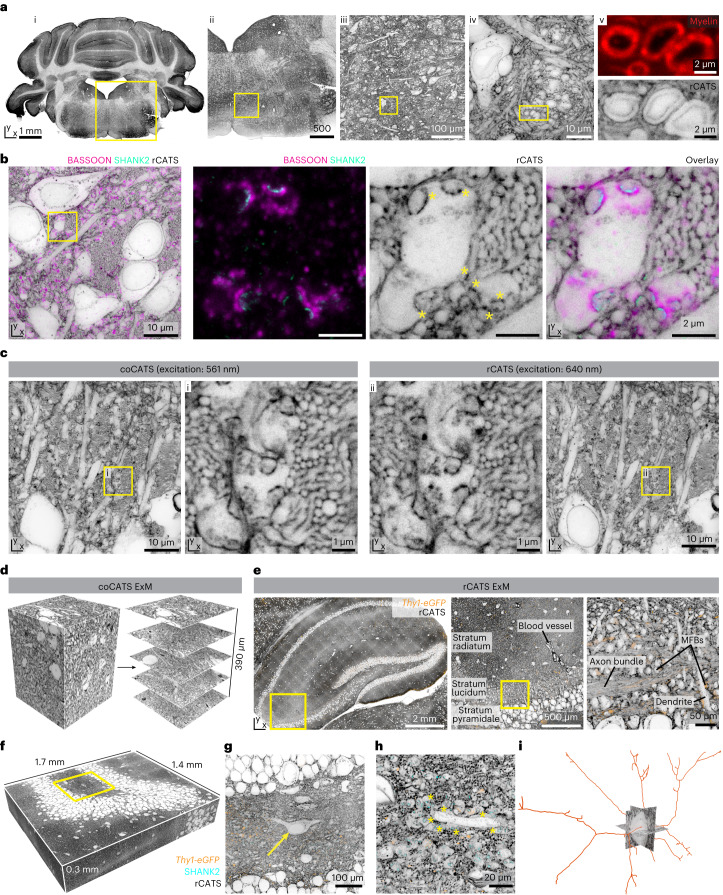
Fig. 5. CATS in previously fixed tissue and CATS with ExM.
a, rCATS (WGA-CF633) in coronal section of cerebellar cortex and hindbrain from fixative-perfused mouse. Overview (left) and progressive zoom-ins in the medulla as indicated. i–iii: confocal; iv: xy-STED; v, top: myelin sheaths (FluoroMyelin, confocal), bottom: rCATS (xy-STED). b, rCATS (gray, WGA-CF633, xy-STED) in hippocampal DG hilus of fixative-perfused mouse with SHANK2 (turquoise, xy-STED) and BASSOON (magenta, confocal) immunolabeling. Zoomed views: MFBs surrounded by mossy fibers. Asterisks: dense labeling at pSCRs. Data in a,b are representative of rCATS in n = 10 perfusion-fixed specimens. c, Combined coCATS (xy-STED, excitation 640 nm) and rCATS (xy-STED, excitation 561 nm) in CA3 by LV microinjection of AF594-NHS, perfusion fixation and rCATS labeling with WGA-CF633. Magnified views: mossy fibers and complex synapses. rCATS/coCATS co-labeling was performed in seven brain sections across n = 3 animals with various fluorophore combinations. d, Organotypic hippocampal slice with coCATS (NHS-PEG12-biotin), ~4-fold expanded via MAP6. Confocal imaging volume (left, N2V) and single planes at increasing depth (right). The ~400-µm axial range corresponds to ~100 µm in original tissue. Data are representative of experiments in n = 3 organotypic slices. e, Hippocampal section from perfusion-fixed Thy1-eGFP adult mouse (eGFP visualized by immunostaining, orange), with rCATS (WGA-biotin) and ~4-fold expansion by proExM8 and zoomed views in CA3 (confocal, raw). Scale bars refer to size after expansion throughout. f, 3D representation of DG crest volume (303 × 371 × 70 µm3 original size) in perfusion-fixed Thy1-eGFP mouse imaged with spinning-disc confocal microscopy after 4.5-fold expansion, with rCATS (gray, WGA-biotin, N2V) and immunostaining for SHANK2 (cyan, N2V) and eGFP (orange, N2V). g, Magnified view of single xy plane as indicated by yellow box. Arrow: hilar mossy cell. h, Different plane at higher magnification. The central dendrite belongs to the mossy cell in g, lined by MFBs with SHANK2 at synaptic sites. Yellow asterisks: subset of MFBs in contact with the dendrite. i, Skeletonization of major branches of the hilar mossy cell in g and h from rCATS data. Whole-section rCATS with proExM was performed in six brain slices across n = 4 animals and skeletonization in n = 1 dataset.

