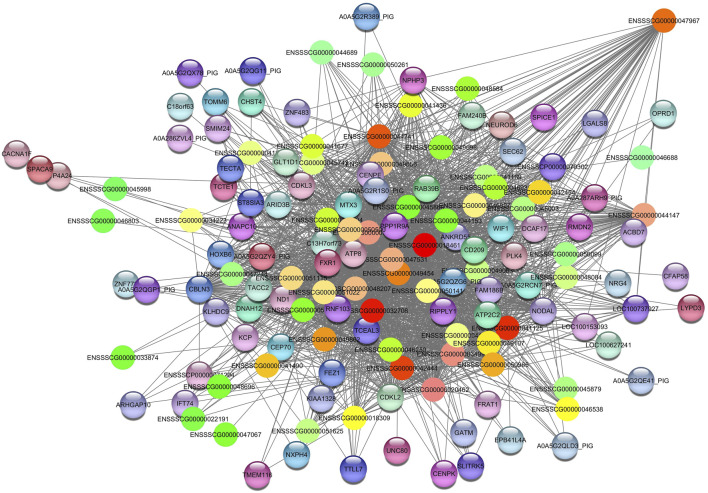
FIGURE 4.
Network view highlighting interactions of the hub gene ENSSCG00000047967. Interaction networks within the liver tissue from pigs fed a diet with 3% soybean oil inclusion (SOY3.0) were constructed using Cytoscape, followed by the stringApp plugin. The network associated with the Darkred module is co-expressed with the albumin phenotype. Colored nodes represent genes/proteins included in the query.

