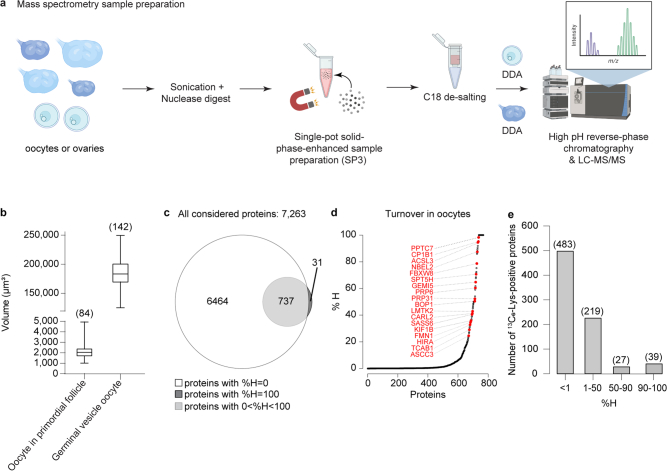
Extended Data Fig. 2. Sample preparation for MS DIA or DDA analysis and protein turnover in oocytes.
(a) Schematic representation of sample preparation for MS DIA or DDA analysis. (b) Box plot showing the volume (µm3) of oocytes in fixed primordial follicles and at germinal vesicle stage from live and fixed samples. Boxplots indicate median, 1st quartile, 3rd quartile, as well as minimum and maximum after outlier removal. Number of oocytes indicated in parenthesis. (c) Venn diagram of 12C6-Lys containing proteins and 13C6-Lys containing proteins detected in mouse oocytes. (d) Rank plot showing inferred remaining fraction of 13C6-Lys labelled proteins (%H) in oocytes for each quantified protein (individual proteins denoted as black circles). Selected examples are highlighted in red. (e) Bar plot showing number of proteins with %H of 0–1, 1–50, 50–90, or 90–100%. Source numerical data are available in source data.

