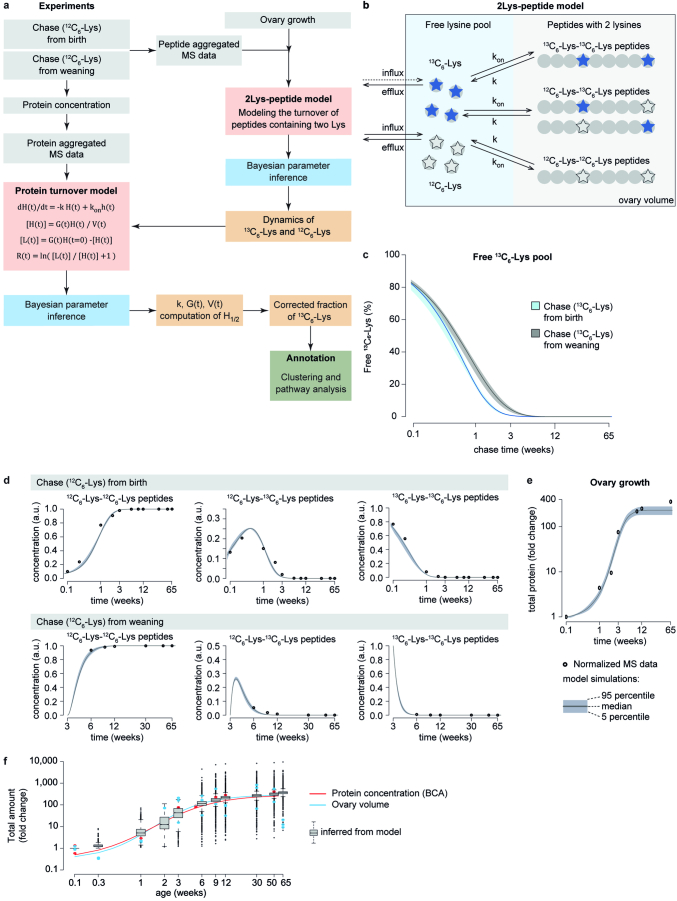
Extended Data Fig. 3. Modelling protein turnover in the ovary.
(a) Overview of the protein turnover modelling approach described in supplemental materials. (b) Graphical illustration of the 2Lys-peptide model to determine the fraction of free 13C6-Lys during ovarian ageing. (c) Estimated fraction of free 13C6-Lys for the 2Lys-peptide model for the chase (12C6-Lys) from birth and from weaning experiments. Solid lines indicate median; shaded areas indicate 5% and 95% confidence ranges. (d-e) Experimental data and model fits of 2Lys-peptide model (d) and total ovary protein fold change (e) over chase time for the chase (12C6-Lys) from birth and from weaning experiments. Dots indicate experimental data; lines and shaded areas indicate median and confidence ranges of model fits. (f) Change of total protein amount in the ovary over mouse age. Total protein amount was determined from BCA measurements and compared to changes in the volume of the ovary. Boxplots indicate the estimated fold change in total protein amount. Boxplots indicate median, 1st quartile, 3rd quartile, as well as minimum and maximum after outlier removal over 3,078 modelled proteins. Even though the volume of the ovary was not considered in the protein turnover model fitting, the estimated fold changes are in good agreement with experimentally measured total protein amount fold changes. Source numerical data are available in source data.

