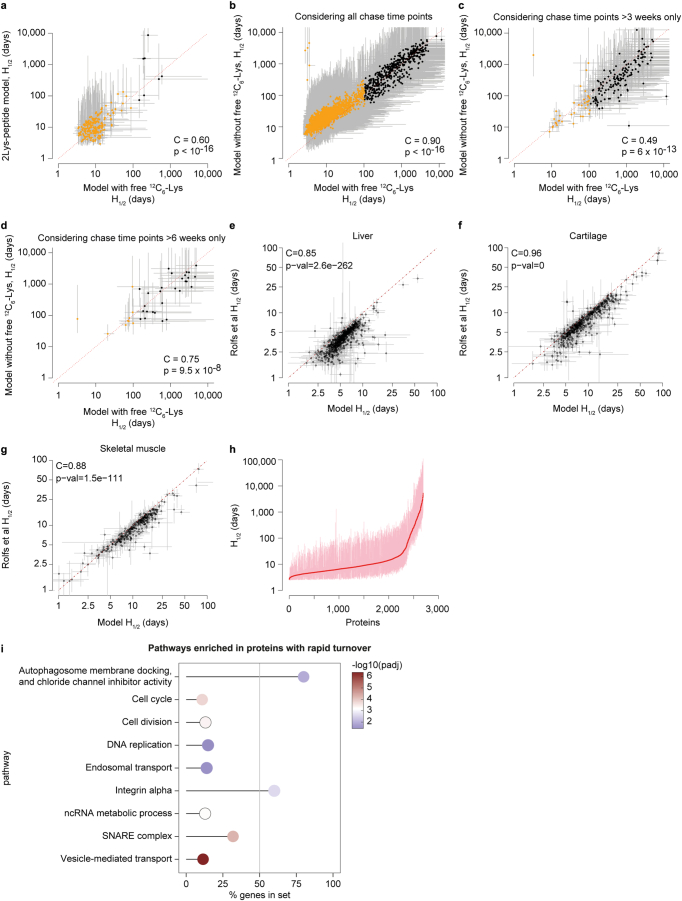
Extended Data Fig. 4. Comparison of the H1/2 values estimated from different models.
(a-d) Comparison of estimated H1/2 values resulting from the protein turnover model considering free 13C6-Lys pool with 2Lys-peptide based model (a) and the ‘classical’ protein turnover model not allowing reincorporation of 13C6-Lys into newly synthesized proteins considering all chase time points (b), or only chase time points larger than 3 weeks (c) or 6 weeks (d), respectively. Dots indicate medians, grey lines indicate confidence ranges. All proteins with estimated H1/2 values < 100 days are indicated as orange dots. (e-g) Comparison of previously published H1/2 values (Rolfs et al.20) and H1/2 values calculated for the same published datasets using the protein turnover model developed in this manuscript for ovaries. Shown are comparisons for liver (e), cartilage (f) and skeletal muscles (g). In (a-g) test for association between paired samples using Spearman correlation coefficient (C) was performed with p-values (p) estimated using algorithm AS 89. p < 10−16 indicates approximated p-values. (h) Rank plot showing median (red dots) and confidence ranges (pink lines) of estimated H1/2 values for all modelled proteins in ovaries. (i) Over-representation analysis of proteins with rapid turnover in ovaries. Shown are the percentage of genes detected in the gene set with their respective adjusted p-values for the most prominent pathways. The p-values are based on the hypergeometric test and have been adjusted for multiple hypothesis testing with Benjamini–Hochberg (BH) procedure. For the complete list of enriched pathways and their corresponding exact p-values, see Supplementary Table 4. Source numerical data are available in source data.

