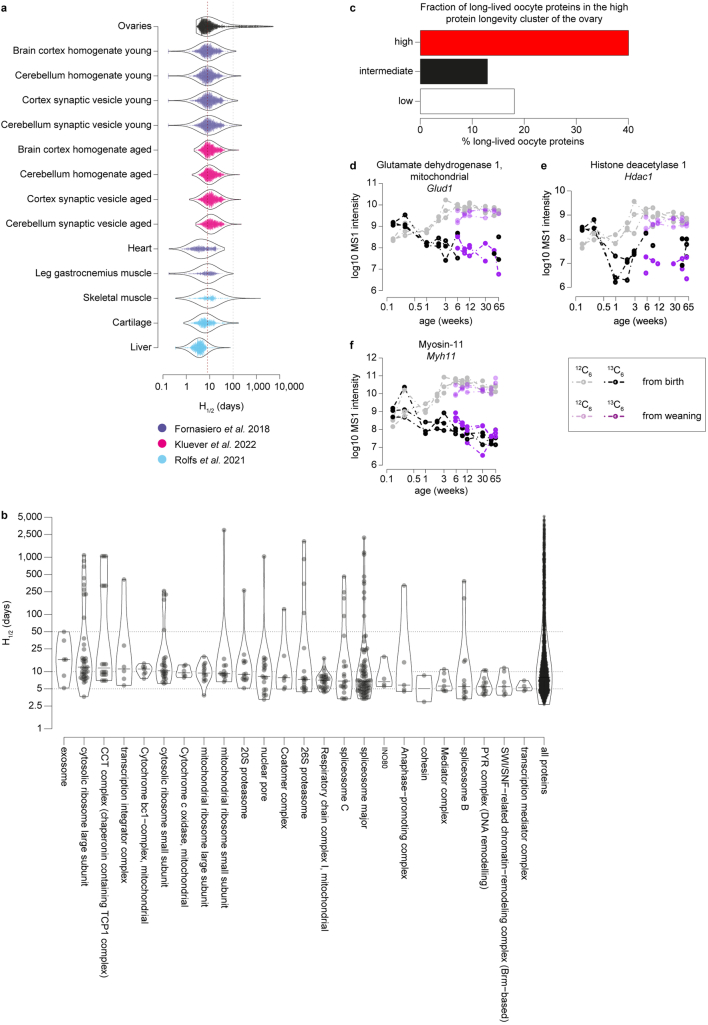
Extended Data Fig. 5. Comparison of the H1/2 values of the different proteins in the ovary with their corresponding H1/2 values in other organs, and examples of long-lived proteins in the ovary.
(a) Distribution of H1/2 determined for various mouse and rat tissues across three studies (Fornasiero et al.19; Kluever et al.21; Rolfs et al.20) compared to the estimated H1/2 distribution in mouse ovary samples in this study. Red line indicates the median H1/2 values in the ovary, while the grey line indicates a H1/2 value of 100. (b) Long-lived members of protein complexes. Shown are protein complexes with long-lived proteins as violin plots. Dots indicate individual proteins. Complexes are sorted by median complex H1/2 values. (c) Fraction of long-lived oocyte proteins in the high protein longevity cluster of the ovary. (d-f) Example MS1 intensities over time in log10 scale for 13C6-Lys- (black and purple) and 12C6-Lys- (grey and pink) labelled peptides for two pulse lengths (pulse with 13C6-Lys until birth and pulse with 13C6-Lys until weaning) for glutamate dehydrogenase 1, mitochondrial (d); histone deacetylase 1 (e); and Myosin-11 (f). Circles indicate experimental data points for three biological replicates, dashed lines are only for visual aid. Source numerical data are available in source data.

