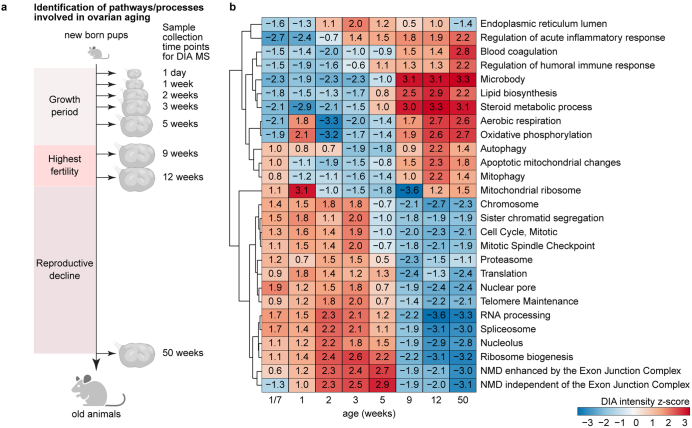
Extended Data Fig. 6. Changes in enrichment scores of different pathways throughout ovarian development and aging.
(a) Schematic overview of experimental design. Ovaries were collected from female mice at 8 time points (1 day, 1, 2, 3, 5, 9, 12 and 50-week-old mice; three animals per time point analysed). Samples were processed for DIA-MS. (b) Gene set enrichment analysis (GSEA) revealed up- and down-regulated pathways over mouse age. For each time point (1 day, 1, 2, 5, 9, 12 and 50 weeks) normalized DIA-MS data for 8,890 detected proteins were subject to GSEA. Normalized enrichment scores for each pathway and time point are shown as heatmap upon hierarchical clustering (dendrogram shown on the left). Each term is significantly enriched at least in one time point. Source numerical data are available in source data.

