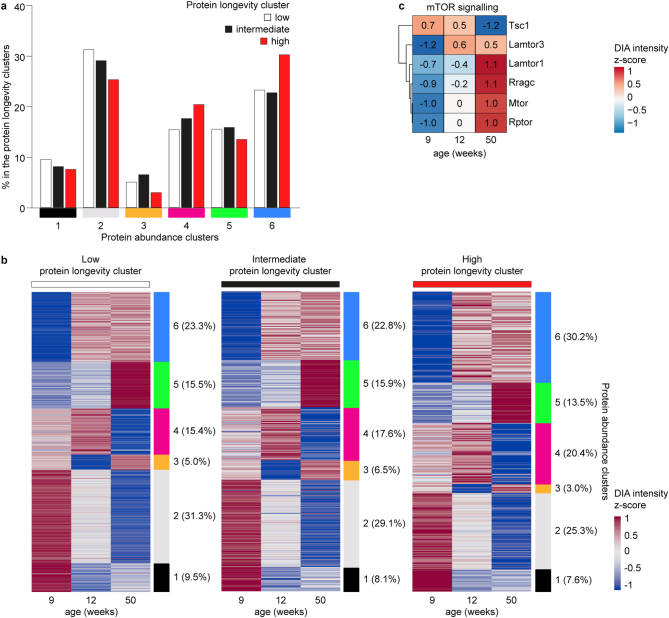
Extended Data Fig. 8. Distribution of ovary proteins in the different protein longevity clusters and protein abundance clusters, and abundance changes over time of proteins in the mTOR signalling pathway.
(a) Percentage of ovary proteins that are detected across the three protein longevity clusters, as well as in one of the six protein abundance clusters derived from the DIA-MS data. (b) Heatmaps showing protein abundance change for low, intermediate, and high protein longevity clusters with assignment to protein abundance clusters. (c) Normalized DIA-MS intensity data showing the abundance changes over time of proteins in the mTOR signalling pathway. Source numerical data are available in source data.

