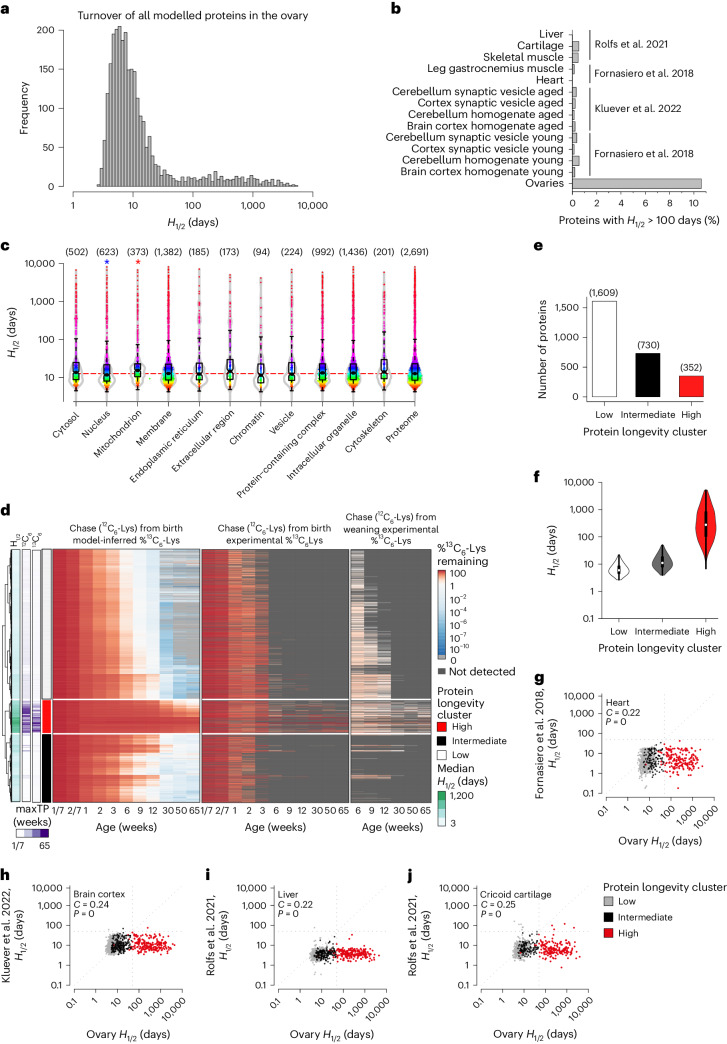
Fig. 3. Mouse ovaries have a >10-fold higher fraction of extremely long-lived proteins than other post-mitotic tissues.
a, Distribution of the modelled H1/2 values in the ovary. b, Fraction of proteins with H1/2 > 100 days in the mouse ovary samples in this study and various mouse and rat tissues across three studies19–21. c, Distributions of estimated H1/2 values for proteins located in indicated subcellular compartments. Red and blue stars indicate significantly larger and smaller H1/2 distributions compared with the whole modelled proteome, respectively (two-sided Kolmogorov–Smirnov test; P values: nucleus 0.0093; mitochondrion 8.84 × 10⁻⁶). Number of proteins in each compartment indicated in parentheses. Boxplots indicate median, first quartile and third quartile, as well as minimum and maximum after outlier removal. d, Cluster analysis of inferred 13C6-Lys levels in the proteins of the aging ovaries. The dendrogram on the left corresponds to the clustering of inferred percentage 13C6-Lys. The leftmost bar shows the medians of inferred proteins half-lives, colouring on log10 scale. The second and third bars indicate the latest time point at which the 13C6-Lys pulse was detected in the data corresponding to chase from birth and weaning. The rightmost bar labels the three identified protein longevity clusters corresponding to proteins with high, intermediate and low amounts of inferred 13C6-Lys content. The leftmost heatmap shows the inferred percentage 13C6-Lys; time points from 6 weeks onwards were used for clustering. Central and rightmost heatmaps show experimental data of the chase 12C6-Lys from birth and weaning, respectively. e, Modelled percentage of 13C6-Lys labelled proteins compared to 12C6-Lys labelled proteins was used to derive three protein longevity clusters (low, intermediate and high inferred 13C6-Lys content). Bar plot showing number of proteins in the low, intermediate and high protein longevity clusters. f, Violin plot showing distributions of inferred half-lives of proteins in the low, intermediate and high protein longevity clusters. Boxplots indicate median, first quartile and third quartile, as well as minimum and maximum after outlier removal. Number of proteins in each cluster as indicated in e. g–i, Dot plots comparing the H1/2 values of different proteins in the ovary (x axis) with organs and tissues (y axis) measured in ref. 19 (g), ref. 21 (h) and ref. 20 (i, liver; j, cricoid cartilage). Test for association between paired samples using Spearman correlation coefficient (C) was performed with P values estimated using algorithm AS 89. Proteins are colour-coded according to the protein longevity cluster they belong to, as in d.

