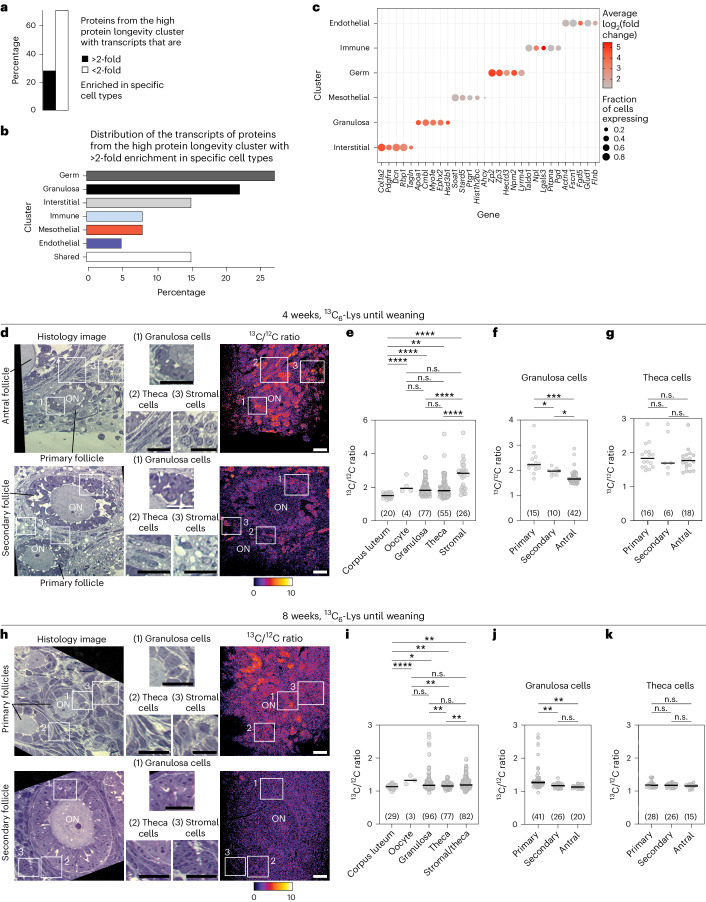
Fig. 5. Subsets of granulosa, stromal and theca cells are long-lived in the ovary.
a, Proportion of the proteins from the high protein longevity cluster with greater or less than twofold enrichment of corresponding transcripts in specific cell types in the ovaries of postnatal day 2 mice. b, Distribution of the transcripts of the proteins from the high protein longevity cluster with greater than twofold enrichment in specific cell types of the ovaries of postnatal day 2 mice. c, Dot plot showing the expression patterns of the transcripts of the proteins from the high protein longevity cluster. Size of the dot represents the proportion of the cells expressing the gene, colour denotes log2(fold change) in the one versus all cell types differential gene expression test. d–k, NanoSIMS imaging of ovaries from 4-week-old (d–g) and 8-week-old (h–k) mice that were pulsed with 13C6-Lys until weaning (3 weeks after birth), followed by a chase period with 12C6-Lys. d,h, Histological sections of ovarian tissue (first column on the left). Insets show magnified areas highlighted in the histological sections (middle section of d and h). 13C6/12C6 ratio image for the indicated histological sections and corresponding values are given on the right-hand side of the magnified insets. e,i, Dot plots showing 13C6 /12C6 signal in different ovarian cell types. f,j, Dot plots showing 13C6 /12C6 signal of granulosa cells in the primary, secondary and antral follicles. g,k, Dot plots showing 13C6 /12C6 signal of theca cells in the primary, secondary and antral follicles. Numbers of analysed cells are shown in parentheses. P values were calculated using unpaired two-tailed Student’s t-test. n.s., not significant; *P ≤ 0.05; **P ≤ 0.01; ***P ≤ 0.001; ****P ≤ 0.0001. Scale bars, 10 µm.

