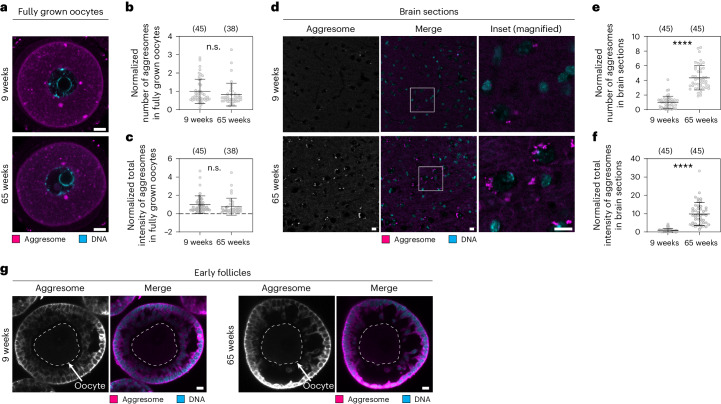
Fig. 6. Protein aggregation does not increase in aged oocytes.
a, Representative immunofluorescence images of fully grown, germinal vesicle stage mouse oocytes from 9-week-old and 65-week-old mice stained with the ProteoStat aggresome dye. Magenta, aggresome (ProteoStat); cyan, DNA (Hoechst). b, Dot plot showing number of ProteoStat-positive structures in oocytes as shown in a. c, Dot plot showing total intensity of ProteoStat-positive structures in oocytes as shown in a. d, Representative immunofluorescence images of brain slices from 9-week-old and 65-week-old mice stained with the ProteoStat aggresome dye. Magenta, aggresome (ProteoStat); cyan, DNA (Hoechst). e, Dot plot showing number of ProteoStat-positive structures in brain slices as shown in d. f, Dot plot showing total intensity of ProteoStat-positive structures in brain slices as shown in d. g, Representative immunofluorescence images of early follicles from 9-week-old and 65-week-old mice stained with the ProteoStat aggresome dye. Magenta, aggresome (ProteoStat); cyan, DNA (Hoechst). No obvious aggresome accumulation was detected in either age group. All data from two independent experiments. Number of analysed oocytes and brain areas are in parentheses. Data are shown as mean ± s.d. P values were calculated using unpaired two-tailed Student’s t-test. n.s., not significant; ****P ≤ 0.0001. Scale bars, 10 µm.

