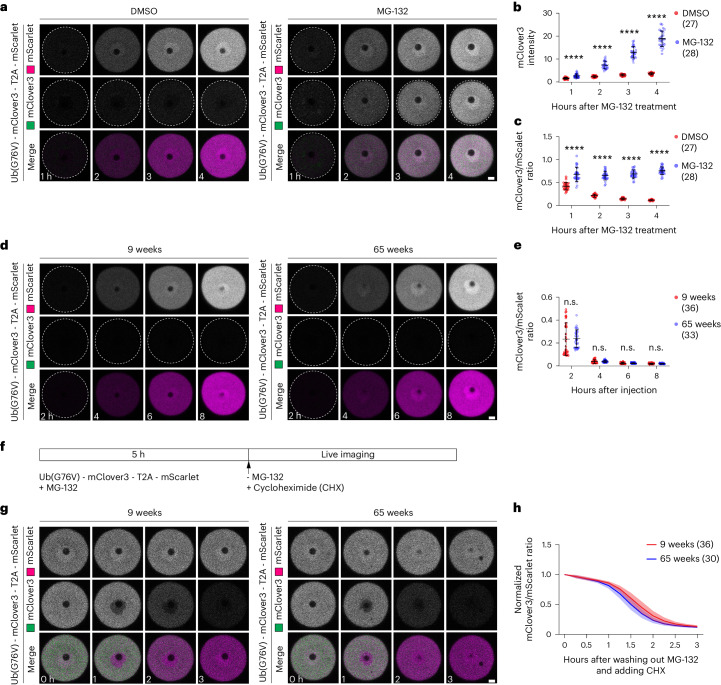
Fig. 7. Proteasomal activity does not decay in aged oocytes.
a, Time-lapse images of mouse oocytes from 9-week-old mice expressing Ub(G76V)-mClover3-T2A-mScarlet in the presence of DMSO or 10 μM MG-132. Time is given as hours after DMSO or MG-132 treatment. b, Quantification of the mean fluorescence intensity of mClover3 in oocytes as shown in a. c, Quantification of the fluorescence intensity ratio of mClover3 to mScarlet in oocytes in a. d, Time-lapse images of mouse oocytes from 9-week-old and 65-week-old mice expressing Ub(G76V)-mClover3-T2A-mScarlet. Time is given as hours after injection of the reporter mRNA. e, Quantification of the fluorescence intensity ratio of mClover3 to mScarlet in oocytes in d. f, Schematic diagram of the experiment shown in g. Ub(G76V)-mClover3 and mScarlet were expressed for 5 h in the presence of MG-132, which blocks the degradation of Ub(G76V)-mClover3. MG-132 was then washed out and oocytes were imaged in the presence of the translation inhibitor cycloheximide (CHX), which blocks the synthesis of new proteins. g, Time-lapse images of mouse oocytes from 9-week-old and 65-week-old mouse oocytes expressing Ub(G76V)-mClover3-T2A-mScarlet. Experiment was performed as shown in f. Time is given as hours after MG-132 washout and CHX wash-in. h, Line graph showing normalized fluorescence intensity ratio of mClover3 to mScarlet in oocytes in g. All data from two independent experiments. Number of analysed oocytes in parentheses. Data are shown as mean ± s.d. P values were calculated using unpaired two-tailed Student’s t-test. n.s., not significant; ****P ≤ 0.0001. Scale bars, 10 µm.

