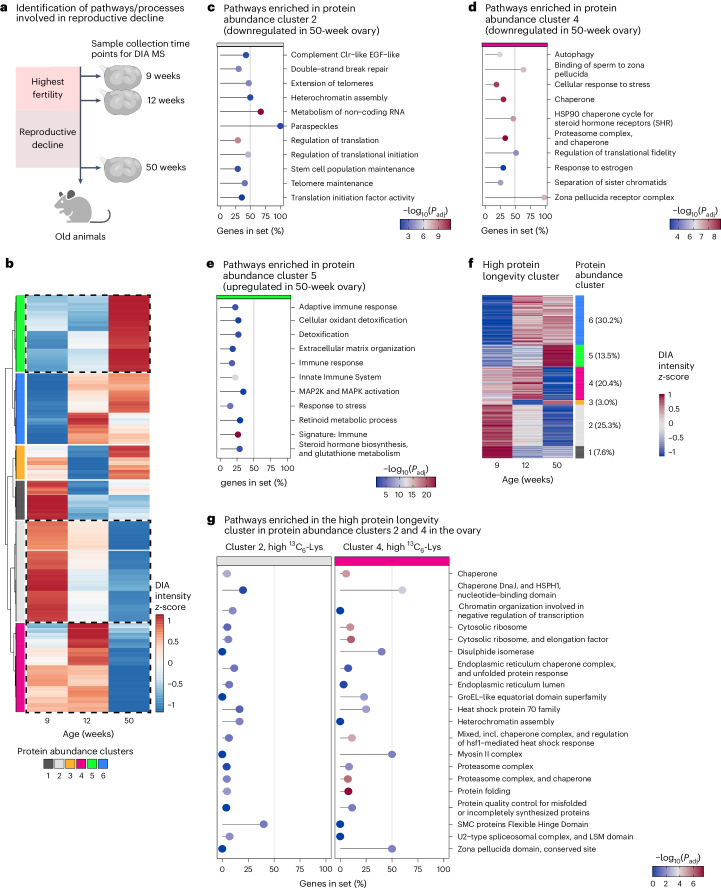
Fig. 8. Proteostasis networks are lost with ovarian aging and decreased fertility.
a, Schematic overview of experimental design. Ovaries were collected from female mice at three time points (9-, 12- and 50-week-old mice; three animals per time point analysed). Samples were processed for DIA-MS. b, Cluster analysis of protein abundances during reproductive decline. Normalized DIA-MS data for 9-, 12- and 50-week-old ovaries were subject to clustering to minimize variance within clusters. Dendrogram of resulting clusters is shown on the left. Colours indicate DIA intensities centred to a mean of 0 and s.d. of 1 on per protein basis. Resulting protein abundance clusters are highlighted with different colour keys. (c-e) Pathway over-representation analysis of protein abundance cluster 2 (c), cluster 4 (d) and cluster 5 (e). f, Heatmaps showing protein abundance change for the high protein longevity cluster with assignment to protein abundance clusters. g, Pathway over-representation analysis of high protein longevity cluster proteins in protein abundance clusters 2 and 4 in the ovary. c–e and g show the proportions of genes detected in the gene set with their respective adjusted P values for the most prominent pathways. The P values are based on the hypergeometric test and have been adjusted for multiple hypothesis testing with Benjamini–Hochberg procedure. For the complete list of enriched pathways and their corresponding exact P values, see Supplementary Table 9.

