


Abstract
Survival prediction integrates patient-specific molecular information and clinical signatures to forecast the anticipated time of an event, such as recurrence, death, or disease progression. Survival prediction proves valuable in guiding treatment decisions, optimizing resource allocation, and interventions of precision medicine. The wide range of diseases, the existence of various variants within the same disease, and the reliance on available data necessitate disease-specific computational survival predictors. The widespread adoption of artificial intelligence (AI) methods in crafting survival predictors has undoubtedly revolutionized this field. However, the ever-increasing demand for more sophisticated and effective prediction models necessitates the continued creation of innovative advancements. To catalyze these advancements, it is crucial to bring existing survival predictors knowledge and insights into a centralized platform. The paper in hand thoroughly examines 23 existing review studies and provides a concise overview of their scope and limitations. Focusing on a comprehensive set of 90 most recent survival predictors across 44 diverse diseases, it delves into insights of diverse types of methods that are used in the development of disease-specific predictors. This exhaustive analysis encompasses the utilized data modalities along with a detailed analysis of subsets of clinical features, feature engineering methods, and the specific statistical, machine or deep learning approaches that have been employed. It also provides insights about survival prediction data sources, open-source predictors, and survival prediction frameworks.
Keywords: survival prediction, artificial intelligence, machine learning, multiomics, cancer
1 Introduction
According to World Health Organization (WHO), around ten thousand diseases have been discovered and each disease has unique characteristics, symptoms, and implications on human health (Haendel et al., 2020). Millions of people died from such diseases in the span of years 2000 to 2019, while cancers, cardiovascular, and infectious diseases persisted as the leading causes of mortality (Jamison, 2018; World Health Organization, 2020). Extensive research on the intersection of life and technology has yielded a wide range of therapies and medications for various well-known diseases [National Research Council (US), 2010]. However, the core idea behind traditional therapies and medications is based on the “one-size-fits-all” (Sellin, 2015). In this paradigm, a single drug is supposed to effectively treat a medical condition across a variety of patient cohorts i.e., children, old and young populations (Al-Lazikani et al., 2012; Sellin, 2015). In-depth exploration and understanding of living organisms' inherent biological processes reveal that high variability in genetics and drug responses make one-size-fits-all medication ineffective (Al-Lazikani et al., 2012; Sellin, 2015).
The groundbreaking discoveries of the factors contributing to the limited effectiveness of generalized medications marked the inception of the era of precision medicine (Ashley, 2016; Kosorok and Laber, 2019). Precision medicine offers customization in tailored medical treatments based on an individual's unique genetic makeup, and optimization in drug selection and dosage based on the individual's lifestyle, and environmental factors (Farrokhi et al., 2023). Precision medicine's adoption and effectiveness have been significantly enhanced by the accurate, cost-effective, and large-scale analysis of molecular information obtained through next-generation sequencing (Kamps et al., 2017).
In the realm of precision medicine, survival prediction plays a pivotal role in tailoring medical treatments to individual needs (Billheimer et al., 2014; Tsimberidou et al., 2019). Survival prediction categorizes patients into distinct risk groups that enhance the efficiency of resource allocation for the patients who are likely to gain the most benefit from specific treatments (Billheimer et al., 2014; Tsimberidou et al., 2019). It also enables counseling of patients and their families by predicting the expected course of the disease and potential challenges (Billheimer et al., 2014). In addition to medical treatments, survival prediction offers multiple advantages in research, particularly in the area of biomarker discovery and disease understanding (Chen et al., 2018; Sarma et al., 2020). Survival prediction models provide useful information about the correlation between different features and clinical outcomes. This correlation information enables the identification of novel biomarkers associated with disease prognosis (Sarma et al., 2020). Moreover, researchers leverage survival prediction to unravel disease heterogeneity which helps to identify distinct subtypes with different survival profiles (Hao et al., 2023). This knowledge not only aids in the stratification of homogeneous patients in clinical trials but also validates therapeutic targets by assessing their relevance in predicting patient outcomes (Glare et al., 2003). Furthermore, it enables the longitudinal monitoring of disease progression that helps to explore critical time points and progression patterns (Carobbio et al., 2020).
To expedite advancements in survival prediction research, researchers are harnessing the capabilities of AI algorithms by utilizing extensive survival-related data from public databases such as the Cancer Genome Atlas Program (TCGA) (Tomczak et al., 2015), and NCI Genomic Data Commons (GDC) (Jensen et al., 2017; Shen et al., 2019; Malik et al., 2021; Mirbabaie et al., 2021; Arjmand et al., 2022; Fan et al., 2023; Pellegrini, 2023). In addition, the diversity and heterogeneity of diseases hinder the development of a universally applicable survival prediction pipeline (Kourou et al., 2015; Hao et al., 2023).
Driven by the necessity for disease-specific predictors, there is a concerted effort to develop more accurate and powerful predictive tools (Baek and Lee, 2020; Jiang et al., 2020; Benkirane et al., 2023). Figure 1 illustrates that for the advancement of survival predictors, public databases provide a spectrum of clinical data (Jung et al., 2023; Qian et al., 2023) and encompass nine diverse omics data modalities, including gene expression (mRNA), micro RNA (miRNA), DNA methylation, copy number variation (CNV), long non-coding RNA (lncRNA), proteomics, metabolic, whole exome sequencing (WES) and mutation (Baek and Lee, 2020; Malik et al., 2021; Han et al., 2022; Jiang et al., 2022). In each data modality, there exists an array of missing values that hinder survival predictors learning. Extensive research is being conducted to impute missing values by using different techniques such as deletion, multiple, K-nearest neighbor (KNN), and median imputation (Van Buuren et al., 1999; Garćıa-Laencina et al., 2015; Chai et al., 2021b). In addition, various normalization methods are also being used to normalize feature space such as quantile (Zhao et al., 2020), variance threshold (Bolstad et al., 2003), and rank normalizations (Ni and Qin, 2021).
Figure 1.

An end-to-end survival prediction pipeline.
In the development of survival prediction pipelines, researchers are trying to unlock the potential of various data modalities by assessing predictor performance with individual modalities and combinations of multiple data modalities across diverse types of diseases (Lee et al., 2020; Hao et al., 2023; Pellegrini, 2023). When data from different modalities is combined, survival predictors' input feature space becomes very large which impedes the performance of AI approaches (Feldner-Busztin et al., 2023). Researchers are trying to explore feature engineering approaches such as random forest importance (RFI), and recursive feature elimination (RFI) (Wang et al., 2022), principal component analysis (PCA) (Lv et al., 2020; Jiang et al., 2022), non-negative matrix factorization (NMF) (Tang et al., 2021), and autoencoders (AEs) (Li et al., 2020; Wang et al., 2020; Owens et al., 2021). Moreover, in an end-to-end survival predictive pipeline, apart from the selection of appropriate data and feature engineering strategy, designing appropriate survival prediction models is also an active area of research (Deepa and Gunavathi, 2022).
Under different aforementioned directions, the recent 3 years have witnessed around 74 different survival predictors for different diseases. To further accelerate and expedite the development of more powerful predictors, in the last 10 years, from time to time, researchers have published 22 different review articles. These articles primarily aim to summarize the latest trends and developments in data modalities, feature engineering methods, and AI models specifically related to survival prediction. However, the focus of these reviews is often constrained to either a singular disease or multiple subtypes of cancer, highlighting a limited scope within the broader landscape of survival prediction research (Herrmann et al., 2021; Pobar et al., 2021; Boshier et al., 2022; Deepa and Gunavathi, 2022; Feldner-Busztin et al., 2023; Rahimi et al., 2023). More comprehensive details about the scope of existing review articles in terms of contributions and drawbacks are summarized in Table 2 and Section 3. Following the need for a comprehensive review article for survival prediction, the contributions of this paper are manifold:
Table 2.
The scope and limitations of current survey papers.
| References | Citations | Number of articles covered | Scope | Shortcomings |
|---|---|---|---|---|
| Deepa and Gunavathi (2022) | 17 | 37 | Cancer survival, subtypes, and recurrence prediction across seven cancer subtypes i.e., breast, lung, gastric, cervical, oral, cystic fibrosis, and multi- cancers | Does not take into account all types of cancers, and other diseases on the basis of multiomics and clinical data. |
| Herrmann et al. (2021) | 59 | NS | A benchmark of different ML and statistical survival analysis methods on multiple cancer datasets from TCGA i.e., bladder, breast invasive, colon, esophegeal, head-neck squamous, kidney renal, cervical kidney, acute myloid leukemia, low grade glioma, liver hepatocellular, lung adenocarcinoma, lung squamous, ovarian cancer, oancreatic, sarcoma, skin cutaneous, stomach, and Uterine corpus cancers. | A benchmark with a limited number of methods for survival modeling. |
| Rahimi et al. (2023) | 2 | 13 | Cervical cancer (CC) survival analysis based on ML and statistical methods to predict Disease-free survival (DFS), progression-free survival (PFS), and overall survival (OS) | The review is confined to cervical cancer survival prediction and does not encompass deep learning-based methods. |
| Bashiri et al. (2017) | 80 | 17 | Survival Prediction based on gene expression data across Mantle cell lymphoma, esophageal adenocarcinoma, Esophageal squamous cell carcinoma, Non- small cell lung carcinomas, Diffuse large B-Cell lymphoma (DLBCL), astrocytic tumor, and Lung cancer | Multiomics data is not extensively discussed, as it is understood that the emphasis on gene expression alone may not define the survival of a subject. |
| Tewarie et al. (2021) | 23 | 27 | Continous and discrete-time survival prediction across glioblastoma based on magnetic resonance images (MRI), genomics, and clinical data | The review paper does not include a discussion of survival prediction models. Also, the role of multiomics data in survival prediction has not been explored. |
| Westerlund et al. (2021) | 23 | NS | Risk prediction in cardiovascular diseases (CVD) based on clinical, and image data, and molecular signatures such as single nucleotide polymorphism (SNP). | - |
| Kresoja et al. (2023) | 5 | NS | An overall spectrum of survival prediction in cardiovascular diseases is presented based on the image, omics, and clinical data. | - |
| Kaur et al. (2022) | 33 | 62 | The authors reviewed how data mining and ML are transforming medical decision-making, focusing on cancer survival research. They analyzed 62 articles from the past 15 years, noting a shift from traditional methods to ML and DL, due to the availability of large digital datasets. The study highlights a move toward using clinical data with smaller sample sizes and an increasing use of DL and hybrid approaches. They identify ten open research issues and suggest future research directions to improve cancer survival predictions, offering insights for both new and experienced researchers. | Limited papers cohort and lack of discussion on multi-omics data modalities and survival endpoints. |
| Wiegrebe et al. (2023) | 4 | 58 | Survival prediction with DL models from five major categories i.e., discrete-time, piece- wise exponential, parametric, ranking-based, and ordinary differential equation (ODE) | While it encompasses numerous models, the paper still lacks coverage of information related to ML models. |
| Salerno and Li (2023) | 5 | NS | ML and DL based methods are discussed for survival analysis with a focus on high dimensionality of the data. Mainly, regularized cox models, support vector machines, random survival forests, boosting, and artificial neural networks are presented. | Only a handful of methods are discussed in this specific review whereas, the number of methods used to deal with high dimensional data is significant in number. |
| Pobar et al. (2021) | 15 | 16 | DL for survival prediction in palliative cancer patients (advanced cancer patients) on the basis of radiomics data and evaluation based on Palliative Prognostic Score (PaP), Palliative Prognostic Index (PPI) and Number of Risk Factors (NRF) | The prime focus is only related to radiomics-based methods. |
| Bakasa and Viriri (2021) | 16 | NS | Pancreatic survival prediction models and the use of DL models such as image segmentation, and feature extraction. Different concepts like image segmentation and feature extraction are discussed in detail with less emphasis on their utilization in ML or DL-based survival prediction. In addition, very few studies are referred related to pancreatic cancer survival prediction. | |
| Ahmed (2005) | 252 | NS | The internal components of artificial neural networks (ANNs) | Authors provide a rough overview of artificial neural networks (ANNs). At the time of this publication, there was approximately very little attention given to survival prediction using ML and DL-based models. Therefore, the review discusses only the internal workings of ANNs rather than discussing the details of survival prediction and the role of AI in it. |
| Kantidakis et al. (2022) | 3 | 24 | Studies related to survival prediction are presented in two different settings i.e., setting 1: time is added as part of the input features and a single output node is specified, setting 2: multiple output nodes are defined for each time interval | Authors discuss different types of neural network setting used for survival analysis yet they did not categorize all the studies related to survival analysis on the basis of the type of neural network setting being used. |
| Altuhaifa et al. (2023) | 0 | 30 | Studies related to cancer survival prediction. The authors present databases utilized for the prediction of cancer survival prediction along with feature selection algorithms, types and nature of features, survival prediction models, and limitations. | Lack of characterization with respect to the multiomics-based data modalities. |
| Wekesa and Kimwele (2023) | 0 | NS | radiomics, and multiomics studies related to different factors that play a critical role in various diseases i.e., miRNA, circRNA, and so on are presented. The prime focus is on data integration techniques based on DL for interaction prediction, disease diagnosis, and treatment. | Only a handful of studies are covered |
| Kvamme and Borgan (2021) | 47 | NS | Authors discuss in detail the architectures and schemes utilized to predict survival in a discrete or continuous fashion. | - |
| Feldner-Busztin et al. (2023) | 13 | NS | Dimensionality reduction in ML models with context to cancer subtype identification, and survival prediction. | The prime focus is on the use of dimensionality reduction in multiomics related tasks. The role of dimensionality reduction in survival prediction has not been covered in this review. |
| Boshier et al. (2022) | 0 | 17 | Survival prediction in esophageal adenocarcinoma is discussed on the basis of clinical data. In addition, various survival prediction models are evaluated on new validation data comprised of 2,450 patients. | Only limited to a single cancer and the focus is only related to clinical data. |
| Gupta et al. (2018) | 38 | 16 | Prognostication in terms of esophageal and gastroesophageal junction cancer on the basis of image and clinical data. | Lack of multiomics-based analysis. |
| Wissel et al. (2022) | - | - | Authors discuss and propose new standardized benchmark datasets and their splits for survival prediction, obtained from TCGA, TARGET, and ICGC databases. The comparison of the AI-based and statistical models is also presented in the paper which shows that statistical models often beat AI-based models in time to event prediction with multiomics data. | - |
| Lee and Lim (2019) | 62 | NS | Different concepts related to survival analysis are discussed i.e., survival functions, Kalpan Meier estimators, and log-rank test. In addition, multiple time-to-event modeling approaches are also presented in detail such as, Cox-PH model, random survival forest, survival support vector machines, bagging, cox boosting, and artificial neural networks. | Limited coverage of omics-based modalities and an in-depth discussion. |
| Guan et al. (2022) | 40 | NS | Subtyping and risk prediction in Schizophrenia. | - |
| Mo et al. (2022) | 0 | NS | A comparison of 12 supervised ML models to predict the outcome of head and squamous cell carcinoma i.e., bayesian network, naive Bayes, logistic regression, generalized linear model, k-nearest neighbor, decision tree, random forest, bootstrap aggregating, and AdaBoost, gradient boosting trees, neural network, and support vector machine. In addition, important genes are further validated using a variety of wet lab experiments. | Only a single multiomics data is used for the comparison of different survival outcome prediction models, whereas multiple datasets can show the generalizability of the models on the data belonging to various demographic locations. |
| Ours | - | 74 | A systematic analysis of diverse survival prediction literature. This review encompasses ML, DL, and statistical survival predictors across more than 30 different diseases. In addition, the review addresses diverse research questions related to the distribution of survival predictors, databases, data modalities, feature engineering methods, survival prediction models, source codes and libraries for the development of survival predictors, and various evaluation measures. | This review paper focuses solely on current trends in survival prediction, omitting basic terminologies and mathematical formulations. For a concise mathematical overview, readers are advised to consult earlier review papers (Lee and Lim, 2019; Kvamme and Borgan, 2021). |
It consolidates a diverse array of 22 survival prediction review papers, bringing together their scopes and limitations under a unified umbrella. This compilation serves as a valuable resource for researchers seeking high-level insights and pertinent information in the field.
It provides comprehensive insights into 74 survival prediction articles published between 2020 and 2023.
The objective is to delve into diverse aspects of the field, extract and furnish useful information from these articles under the following different research questions (RQs) and objectives: (i) What is the distribution of 74 research articles across 44 different diseases, and how does it vary among cancer subtypes and other diseases? (ii) How do studies address the spectrum of survival prediction, from a broader perspective covering multiple cancer subtypes to individual subtypes? (iii) What are the predominant survival endpoints used in studies, and how are studies distributed across four endpoints overall survival (OS), disease-free survival (DFS), progression-free survival (PFS), and biochemical recurrence (BC)? (iv) What are the most commonly used public and private data sources in existing survival prediction studies and the types of data they encompass? (v) What are the most commonly used omics data modalities and their associations with different diseases and survival endpoints? (vi) Which clinical features are most commonly employed in survival prediction studies? (vii) How have feature engineering techniques evolved across different data modalities, diseases, and survival endpoints in survival prediction studies? (viii) Which specific statistical, machine learning (ML), and deep learning (DL) survival prediction algorithms have been applied to diverse diseases and survival endpoints? (ix) Which survival prediction studies have made their source codes publicly available, and what types of methods are available in open-source survival prediction frameworks? (x) What are the most commonly utilized survival prediction evaluation measures? (xi) Which conferences and journals predominantly publish survival prediction studies?
2 Background
Survival prediction makes use of patient-specific molecular information and clinical signatures to forecast a wide range of events at particular time intervals (Pellegrini, 2023). The most common events include recurrence, metastasis, response, hospitalization, recovery, and progression of a disease. Some of these events represent similar contexts, i.e., metastasis and progression, both contribute to the overall progression of the condition/cancer (Murthy et al., 2004). Survival prediction events are generally categorized into 4 different survival endpoints namely, overall survival (OS) (Driscoll and Rixe, 2009), disease-free survival (DFS) (Sargent et al., 2005), progression-free survival (PFS) (Gyawali et al., 2022), and biochemical recurrence (BC) (Boorjian et al., 2011). Survival endpoints serve as crucial measures for assessing the outcomes of interventions, indicating the duration until specific events occur. Therefore, events are essentially the occurrences that contribute to the survival endpoints (Fiteni et al., 2014). These endpoints are critical to examine the trajectory of a particular disease (Fiteni et al., 2014; Gyawali et al., 2022). These survival endpoints are clearly defined in Table 1.
Table 1.
Common clinical/survival endpoints in cancer studies.
| Endpoint | Definition | Example in cancer |
|---|---|---|
| Overall survival (OS) | Time from diagnosis or treatment initiation to death from any cause | Time from breast cancer diagnosis to death from any cause |
| Disease-free survival (DFS) | Time from treatment initiation to disease recurrence or death from any cause, whichever occurs first | Time from colorectal cancer surgery to disease recurrence or death |
| Progression-free survival (PFS) | Time from treatment initiation to disease progression or death from any cause, whichever occurs first | Time from lung cancer treatment to tumor progression or death |
| Biochemical recurrence (BC) | Return of cancer based on biochemical markers, typically measured in prostate-specific antigen (PSA) levels | Increase in PSA levels after prostate cancer treatment |
Survival prediction is time to event approach with two distinct aspects, i.e., survival and hazard function (Kleinbaum and Klein, 1996). Survival function describes the probability that a subject survives longer than some specified time t. Mathematically, it is expressed as:
where T is the random variable for survival time, t is a specific value of interest for T. For instance, S(10) represents the probability of survival beyond 10 years without experiencing a specific event. As time passes, S(t) decreases, reflecting the reduction in the probability of surviving without the occurrence of event E up to time t.
In comparison, the hazard function illustrates the probability of an event E occurring at a specific time interval (Δt) with a prior assumption that the event has not taken place. The probability that the event E occurs within a very small time interval Δt around time t is given by the conditional probability:
Dividing this probability by the length of the time interval (Δt) gives the rate of occurrence of the event at time t. The limit as the time interval (Δt) approaches zero gives the instantaneous rate of occurrence at time t. Mathematically, this is represented as:
where f(t) represents the probability density function of survival time. Thus, survival function S(t) shows that the subject survives beyond a specific time point and hazard function h(t) complements this by providing a risk rate that a patient does not survive in a specific time interval conditioned on having survived thus far. Moreover, S(t) is always monotonic in nature, however h(t) is classically assumed to follow increasing Weibull, decreasing Weibull, or lognormal survival curves (Kleinbaum and Klein, 1996; Murthy et al., 2004).
3 A look-back into existing review studies
In recent years multiple review papers have been published and the objective of each review revolves around summarizing fundamental concepts in survival prediction and identifying trends in statistical, ML, and DL algorithms that have been utilized in the development of survival predictors. Table 2 illustrates a high-level overview of the existing 22 review articles in terms of their review scope and limitations. This comprehensive summary aims to assist researchers in locating specific information within relevant articles more effectively.
In Table 2, a comprehensive analysis of the scope of review articles indicates that existing studies can be classified into three distinct groups. (I) Nine review papers primarily focus on the application of DL algorithms in survival prediction (Ahmed, 2005; Bakasa and Viriri, 2021; Kvamme and Borgan, 2021; Pobar et al., 2021; Kantidakis et al., 2022; Altuhaifa et al., 2023; Salerno and Li, 2023; Wekesa and Kimwele, 2023; Wiegrebe et al., 2023), (II) seven review papers summarize the application of ML algorithms in survival prediction (Gupta et al., 2018; Lee and Lim, 2019; Boshier et al., 2022; Guan et al., 2022; Mo et al., 2022; Wissel et al., 2022; Feldner-Busztin et al., 2023), andsix review papers summarize survival prediction methods from three different categories namely statistical, ML, and DL methods (Bashiri et al., 2017; Herrmann et al., 2021; Tewarie et al., 2021; Westerlund et al., 2021; Deepa and Gunavathi, 2022; Rahimi et al., 2023).
On the other hand, in the realm of disease specific survival predictors scope of existing review papers is limited. For instance, eight papers only summarize survival predictors on single disease or subtype of cancer, i.e., cervical cancer (Rahimi et al., 2023), glioblastoma (Tewarie et al., 2021), esophageal adenocarcinoma (Boshier et al., 2022), esophageal and gastroesophageal junction cancer (Gupta et al., 2018), head and squamous cell carcinoma (Mo et al., 2022), palliative cancer patients (Pobar et al., 2021), cardiovascular diseases (CVD) (Westerlund et al., 2021; Kresoja et al., 2023), and schizophrenia (Guan et al., 2022). Although four papers cover multiple subtypes of cancer but they cover only handful of eight different subtypes such as, breast, lung, gastric, colon, esophageal, ovarian cancers and so on.
While the scope of survival prediction extends beyond multiple diseases, existing review papers fall short to summarize current trends of data modalities, feature engineering approaches and survival prediction models. For example, Deepa and Gunavathi (2022) specifically address the primary categories of data modalities used for survival prediction, namely multiomics and clinical data. However, the review does not extensively explore trends and patterns related to the nine different omics types i.e., gene expression (mRNA), micro RNA (miRNA), methylation, copy number variation (CNV), whole exome sequencing (WES), long noncoding RNA (lncRNA), mutation, metabolic, and proteomics, or clinical features associated with distinct cancer subtypes. Similarly, Westerlund et al. (2021) do not explore the potential of multiomics data in terms of cardiovascular diseases. In addition, various review papers completely neglect to address feature engineering in survival prediction (Ahmed, 2005; Bashiri et al., 2017; Gupta et al., 2018; Pobar et al., 2021; Kantidakis et al., 2022; Rahimi et al., 2023). For instance, Feldner-Busztin et al. (2023) despite their focus on dimensionality reduction, fall short in providing a comprehensive summary of current trends in feature engineering approaches with respect to diseases and data modalities. Furthermore, a small portion of these review papers cover details of few state of the art survival prediction models (Ahmed, 2005; Kantidakis et al., 2022; Wiegrebe et al., 2023). While current review papers summarize survival prediction pipelines partially, there is a necessity to bring diverse information into a unified platform which offers comprehensive insights into patterns and trends associated with survival prediction pipelines.
4 Methodology
This section explains different steps or stages of preferred reporting items for systematic review and meta-analyses (PRISMA) strategy (Moher et al., 2010), which is used to gather relevant papers on survival analysis. Figure 2 provides a visual representation of various stages form PRISMA that are summarized in the following subsections.
Figure 2.

PRISMA flow diagram: a step-by-step process for articles search and their inclusion or exclusion criteria to generate a set of studies for further in-depth trends analysis. The included papers are collected from Jan 2020 to Jul 2023.
4.1 Search strategy
In Figure 2, the identification stage illustrates combinations of different keywords that are used to search research articles. The keywords block has two different types of operators “∧” and “∨” operators. On the basis of these operators one keyword from each block is selected and various search queries are formulated such as, “SURVIVAL PREDICTION AND AI AND OMICS”, “SURVIVAL PREDICTION AND AI AND Multiomics”, “SURVIVAL Machine Learning AND OMICS”, and so on. These queries are utilized in literature search engines like lens (https://www.lens.org/), and Google Scholar for literature search from Jan 2020 to Jul 2023.
4.2 Eligibility and screening strategy
With an aim to retain literature related to survival prediction, two different screenings are performed on the basis of the following criteria;
Articles that use only image-based datasets for survival prediction.
Articles that do not make use of ML, DL, or statistical methods for survival prediction.
Articles with closed access.
Initially, guided by the title and abstract of the articles, more than 800 studies are discarded. Subsequently, at the final step, based on a comprehensive review of the full text a second screening is performed, resulting in the exclusion of an additional 20 studies. Ultimately, 90 papers are selected for the final comparison and discussion of survival prediction.
5 Results
5.1 RQ I, II, III: survival predictors distribution analysis across diseases and survival endpoints
The primary aim of this section is to summarize the distribution of survival predictors across various diseases and survival endpoints. Predictors distribution analysis under individual diseases offers insights into the most active trends of predictors associated with specific diseases. This consolidated distribution provides a centralized platform to access valuable information about their disease of interest. Similarly, examining the distribution of articles across survival endpoints is valuable for identifying current trends in forecasting multiple events. This approach not only enhances our understanding of the current state of predictive modeling but also facilitates researchers in efficiently accessing information specific to their desired endpoints. Through this exploration, we aim to contribute to a deeper understanding of the diverse landscape of survival prediction research and its applications across various diseases and endpoints.
Table 3 illustrates disease specific predictors distribution for both cancer and other diseases, respectively. In the last 3 years, 74 predictors have been designed for different cancer subtypes related survival prediction (Tan et al., 2020; Fan et al., 2023; Majji et al., 2023) while only 17 predictors have been designed for other diseases such as cardiovascular diseases, COVID-19, cardiomyopathy, esophagectomy and trauma (Kantidakis et al., 2020; Abdelhamid et al., 2022; Feng et al., 2022; Farahani et al., 2023; Qian et al., 2023; Rahman et al., 2023).
Table 3.
Distribution of survival predictors across individual diseases.
| Disease subtype | Number of studies | References |
|---|---|---|
| Nasopharyngeal carcinoma: | 1 | Miao et al., 2022 |
| HER2-negative metastatic breast cancer | 1 | Wang J. et al., 2023 |
| Tripple negative breast cancer | 1 | Zhang et al., 2023 |
| Breast invasive carcinoma | 1 | Hao et al., 2023 |
| Colon adenocarcinoma | 1 | Lv et al., 2020 |
| Gastric cancer | 1 | Li et al., 2020 |
| Gastrointestinal cancer | 1 | Jung et al., 2023 |
| Adult diffuse glioma | 1 | Yang Q. et al., 2020 |
| Invasive ductal carcinoma | 1 | Lin et al., 2022 |
| Pancreatic cancer undergoing biliary drainage | 1 | Zhou et al., 2023 |
| Kidney renal clear cell carcinoma | 2 | Zhao L. et al., 2021; Hao et al., 2023 |
| Lung squamous cell carcinoma | 1 | Hao et al., 2023 |
| Cervical cancer | 1 | Hu Q. et al., 2021 |
| Neuroblastoma | 1 | Wang et al., 2022 |
| Rectal cancer | 1 | Zhang J. Z. et al., 2022 |
| Colon cancer | 3 | Tong D. et al., 2020; Yang H. et al., 2020; Lee et al., 2023 |
| Liver cancer | 1 | Wang et al., 2020 |
| Esophageal carcinoma | 2 | Yu et al., 2020; Bichindaritz and Liu, 2022 |
| Stomach adenocarcinoma | 1 | Zhao L. et al., 2021 |
| Ovarian serous cystadenocarcinoma | 2 | Zhao L. et al., 2021; Bichindaritz and Liu, 2022 |
| Kidney renal clear cell carcinoma | 2 | Zhao L. et al., 2021; Jiang et al., 2022 |
| Lower grade glioma | 1 | Wu et al., 2022 |
| Head-and-neck squamous cell carcinoma | 1 | Zhao L. et al., 2021 |
| Bladder cancer | 3 | Chai et al., 2021a; Tang et al., 2021; Chauhan et al., 2023 |
| Bladder urothelial carcinoma | 1 | Zhao L. et al., 2021 |
| Renal cell carcinoma | Tong et al., 2021; Shetty et al., 2023 | |
| Lymphoma | 1 | Li et al., 2023 |
| Hepatocellular carcinoma | 3 | Owens et al., 2021; Zhang R. et al., 2022; Wang X. et al., 2023 |
| Ovarian cancer | 5 | Hira et al., 2021; Pawar et al., 2022; Wu and Fang, 2022; Lang et al., 2023; Wang X. et al., 2023 |
| Glioblastoma | 4 | Du et al., 2020; Kazerooni et al., 2021; Redekar et al., 2022; Wu and Fang, 2022 |
| Prostate cancer | 3 | Doja et al., 2020; Li et al., 2021; Pellegrini, 2023 |
| Non-small cell lung cancer | 5 | Zhang Z.-S. et al., 2021; Ellen et al., 2023; Manganaro et al., 2023; Wang Q. et al., 2023 |
| Pancreatic cancer | 3 | Baek and Lee, 2020; Han et al., 2022 |
| Breast cancer | 10 | Tong L. et al., 2020; Hu S. et al., 2021; Malik et al., 2021; Zhou et al., 2021; Wu and Fang, 2022; Zhang J. Z. et al., 2022; Othman et al., 2023; Palmal et al., 2023; Zarean Shahraki et al., 2023; Zhu et al., 2023 |
| Lung adenocarcinoma | 4 | Jiang et al., 2020; Lee et al., 2020; Zhang S. et al., 2022; Bhat and Hashmy, 2023 |
| Pan-cancer | 7 | Tan et al., 2020; Zhang X. et al., 2021; Zheng et al., 2021; Yin et al., 2022; Benkirane et al., 2023; Fan et al., 2023; Majji et al., 2023 |
| Colorectal cancer | 1 | Willems et al., 2023 |
| Atherosclerosis | 3 | Hathaway Q. A. et al., 2021; Hathaway Q. et al., 2021; Qian et al., 2023 |
| Myocardial infarction | 1 | Feng et al., 2022 |
| Stroke | 1 | Feng et al., 2022 |
| COVID-19 | 1 | Richard et al., 2022 |
| Cardiovascular disease | 6 | Unterhuber et al., 2021; Vahabi et al., 2021; Xu et al., 2021; Zeng et al., 2021; Feng et al., 2022; Moreno-Sanchez, 2023 |
| Liver transplant | 2 | Kantidakis et al., 2020; Raju and Sathyalakshmi, 2023 |
| Trauma | 1 | Abdelhamid et al., 2022 |
| Metastatic urothelial cancer | 1 | Tarango et al., 2023 |
| Hypertrophic cardiomayopathy | 1 | Farahani et al., 2023 |
| Papillary thyroid carcinoma | 1 | Lun et al., 2024 |
| Esophagectomy | 1 | Rahman et al., 2023 |
| Diffuse large B-cell lymphoma | 1 | Pant et al., 2023 |
To date, approximately more than 100 different cancer subtypes have been identified (Grever et al., 1992). However, a deeper analysis of the last 3 years reveals that survival prediction models have been developed for only 40 distinct cancer subtypes, as outlined in Table 3. Among 36 different subtypes, most of the predictors have been designed for breast cancer, lung adenocarcinoma, ovarian cancer, and glioblastoma. On the other hand, seven different predictors have been designed for pancancer. Notably, there is a difference between other cancer types and pan-cancer because under this paradigm predictors simultaneously deal with multiple cancer subtypes. Pan-cancer based survival prediction entails predicting patient survival outcomes using data and models applicable to various cancer types (Fan et al., 2023). Instead of focusing on just one type of cancer, this approach draws on data from multiple cancers to identify shared patterns and markers that influence survival. By combining a diverse array of genetic, molecular, and clinical features that are common across different cancers, this method aims to improve the accuracy of survival predictions (Wu et al., 2023). For the development of pan-cancer based predictors, there exists public data having more than 30 distinct cancer subtypes (Liu et al., 2018). However, researchers are utilizing different subsets for the development of predictors (Fan et al., 2023). Figure 3 provides an overview of multiple survival prediction studies that encompass a range of cancer subtypes, either within a pan-cancer context or within the context of predicting survival for different subtypes. A total of 14 studies have taken into account multiple cancer subtypes whereas the majority of the studies have only covered only a single type of cancer subtype such as colorectal cancer (Willems et al., 2023), lymphoma (Li et al., 2023), colon adenocarcinoma (Lv et al., 2020), gastric cancer (Li et al., 2020), and so on.
Figure 3.
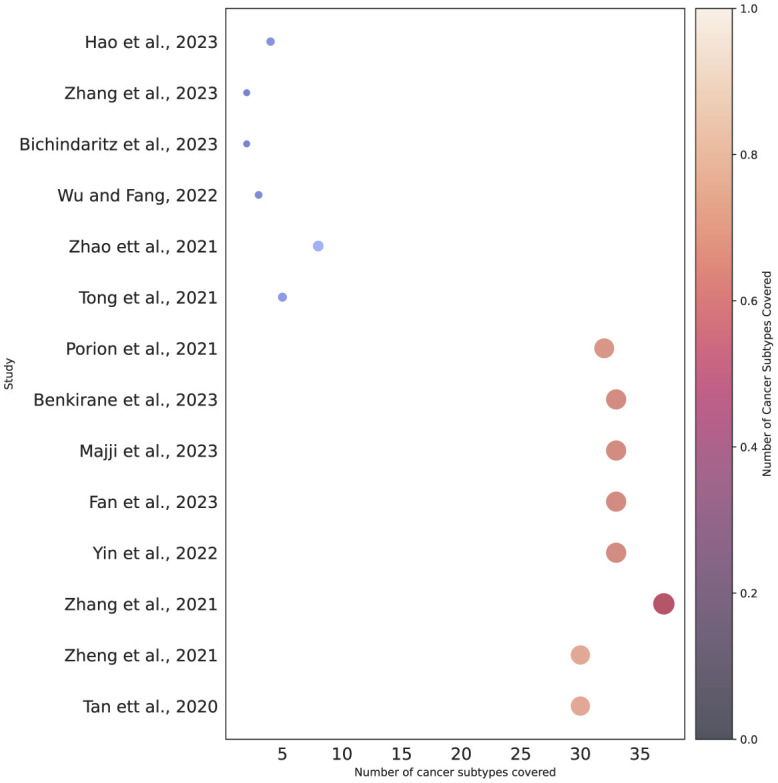
Cancer subtypes coverage based on pan-cancer or individual subtype settings.
Figures 4, 5 illustrate predictors distribution across survival endpoints. A majority of studies 67 (76%) have OS as an endpoint of survival prediction (Chai et al., 2021a; Abdelhamid et al., 2022; Benkirane et al., 2023; Bhat and Hashmy, 2023), whereas eight studies have incorporated multiple survival endpoints in their analysis. Out of eight studies, three studies have incorporated DFS and BC (Lee and Wang, 2003; Baek and Lee, 2020; Pellegrini, 2023). Two studies have incorporated OS, DFS, and PFS (Tan et al., 2020; Tang et al., 2021) and two studies have OS, and PFS as the survival endpoints (Jiang et al., 2022; Chauhan et al., 2023), one focuses on OS and DFS (Pant et al., 2023). A single study has focused on DFS only (Manganaro et al., 2023), and two only on BC (Li et al., 2021; Vahabi et al., 2021). The rest of studies either did not explicitly specify their endpoints for survival prediction or predominantly concentrated on predicting patients' survival outcomes without a specific focus on distinct survival endpoints.
Figure 4.

Survival endpoint distribution across diverse studies.
Figure 5.
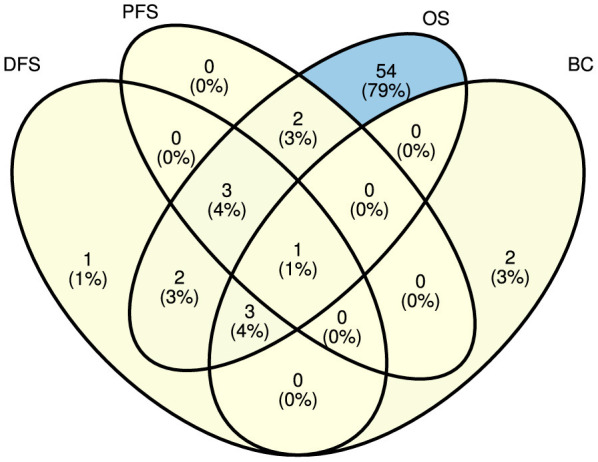
Distribution of explored survival prediction streams from existing literature. DFS, disease-free survival; PFS, progression-free survival; OS, overall survival; BC, biochemical recurrence.
5.2 RQ IV: survival prediction data availability in public and private sources and opportunities for development of predictors
Survival prediction models development relies on the quality and quantity of annotated data, which is generated through extensive wet lab experiments. Experimental findings are stored in different types of databases that open new doors for the development of survival prediction applications. However, there exist multiple databases and each database encompasses particular diseases and modality specific survival data. For instance, CGGA (Zhao Z. et al., 2021) focuses on brain tumors, and MESA (Bild et al., 2002) contains data related to atherosclerosis. To accelerate the development of more competent survival predictors, it is essential to summarize which database contains which type of disease and what data modalities. In the highlight of research question IV, Table 4 illustrates public databases details in terms of diseases and data modalities they offer.
Table 4.
The ample collection of survival data within diverse public databases.
| Data source | Diseases covered | Types of data | URL | Description |
|---|---|---|---|---|
| GDAC Broad Firehose (Voet et al., 2022) | 38 different cancer subtypes | Clinical, CNV, methylation, miRNA, mRNA, mutation, proteomics | https://gdac.broadinstitute.org/ | The Firehose platform provides processed and analyzed data from TCGA, making it accessible to researchers for further analysis and interpretation. |
| Chinese Glioma Genome Atlas (CGGA) (Zhao Z. et al., 2021) | Brain Tumor | Clinical, single cell RNA, mRNA, image, and microarray | http://www.cgga.org.cn/ | The Chinese Glioma Genome Atlas (CGGA) is a genomic database focused on glioma, providing comprehensive molecular characterization and clinical information to advance the understanding and treatment of glioma tumors. |
| TARGET | Pediatric cancers such as osteosarcoma, neuroblastoma, rhabdoid cancer, Wilms, acute myloid leukemia, acute lymphoblastic leukemia | Clinical, mRNA, miRNA, methylation, proteomic and CNV | https://www.cancer.gov/ccg/research/genome-sequencing/target | The TARGET (Therapeutically Applicable Research to Generate Effective Treatments) NCI (National Cancer Institute) database is dedicated to pediatric cancers, offering molecular and clinical data to facilitate research and the development of targeted therapies for pediatric cancer patients. |
| SEQC (Zhang et al., 2015) | Neuroblastoma | Microarray, and mRNA | – | RNA-seq and microarray data to predict clinical/survival endpoints for neuroblastoma, |
| MsigDb (Liberzon et al., 2011) | – | Curated gene sets, motif gene sets, gene ontology terms, oncogenic signatures, and immunologic signatures | https://www.gsea-msigdb.org/gsea/msigdb | The Molecular Signatures Database (MSigDB) is a collection of annotated gene sets, pivotal for gene set enrichment analysis, encompassing diverse biological pathways and functions, aiding researchers in studying gene expression patterns. |
| GTEX (Stanfill and Cao, 2021) | 54 non-diseased tissue sites across nearly 1,000 individuals | Single cell, mRNA, methylation, chip-seq, histology images | https://www.gtexportal.org/home/ | The Genotype-Tissue Expression (GTEx) project is a comprehensive research initiative that characterizes the genetic and tissue-specific gene expression patterns across a diverse set of human tissues, providing valuable insights into the relationship between genetic variation and gene regulation. |
| Kaggle | Not disease-specific | Clinical | https://www.kaggle.com/ | Kaggle is an online platform that hosts data science competitions and facilitates collaboration among data scientists, offering datasets and a community for learning and problem-solving. In addition, Kaggle is not specifically designed for omics-based datasets or studies. |
| MESA (Bild et al., 2002) | Heart diseases | Clinical, genetic, and imaging | https://www.mesa-nhlbi.org/default.aspx | The Multi-Ethnic Study of Atherosclerosis (MESA) MESA is a research study by the National Heart, Lung, and Blood Institute, involves 6,000+ individuals from six U.S. communities, assessed at affiliated university clinics |
| UCSC Xena (Goldman et al., 2018) | Various cancer subtypes that are present in TCGA | Clinical and omics data modalities associated with TCGA | https://xena.ucsc.edu/ | UCSC Xena is a bioinformatics platform offering a user-friendly interface for the exploration and visualization of integrated multi-omic and clinical datasets, enabling researchers to analyze and interpret diverse biological and disease-related information collaboratively. |
| GEO (Clough and Barrett, 2016) | Plethora of diseases such as cardiovascular and neurological diseases and cancers | Clinical, mRNA, miRNA, CNV, methylation, chromatin interaction, DNA modification, splicing, lncRNA, and mutation | https://www.ncbi.nlm.nih.gov/geo/ | The Gene Expression Omnibus (GEO) is a publicly accessible repository, maintained by the National Center for Biotechnology Information (NCBI), housing a diverse collection of high-throughput functional genomics datasets, enabling researchers to freely access and analyze gene expression and other omics data across a broad spectrum of biological conditions and diseases. GEO does not have a specific or dedicated portal for survival prediction datasets. |
| TCGA-GDC (Tomczak et al., 2015) | More than 40 cancer subtypes such as glioblastoma, pancreatic, bladder, breast and rectal cancers | Clinical, mRNA, miRNA, CNV, methylation, methylation, miRNA, splicing, lncRNA, and mutation | https://www.cancer.gov/ccg/research/genome-sequencing/tcga | Cancer genome atlas (TCGA) generates genomics data, while GDC is the platform that hosts and shares not only TCGA data but also other cancer genomics datasets, promoting data accessibility and collaboration in the cancer research community. |
| UK Biobank (Bycroft et al., 2018) | Population-based cohort study with over 500,000 participants, collecting extensive health and genetic data | Clinical, genetic, imaging, lifestyle, and environmental data | https://www.ukbiobank.ac.uk/ | UK Biobank is a large-scale prospective cohort study that aims to improve the prevention, diagnosis, and treatment of a wide range of illnesses, including cancer, by providing a rich resource for researchers to study the complex interplay between genetic, environmental, and lifestyle factors. |
A deeper analysis of existing survival predictors reveals that among the 90 studies 58 utilized publicly accessible data from three key databases: the Cancer Genome Atlas Program (TCGA) (Tomczak et al., 2015), NCI Genomic Data Commons (GDC) (Jensen et al., 2017), and the Gene Expression Omnibus (GEO) (Clough and Barrett, 2016; Chai et al., 2021a; Hu Q. et al., 2021; Poirion et al., 2021; Zhao L. et al., 2021; Han et al., 2022; Jiang et al., 2022; Redekar et al., 2022; Wu and Fang, 2022; Wu et al., 2022; Zhang R. et al., 2022). Apart from public databases, there also exist private databases that have been utilized in existing survival prediction studies (Vahabi et al., 2021; Feng et al., 2022; Miao et al., 2022; Richard et al., 2022; Chauhan et al., 2023; Lee et al., 2023; Moreno-Sanchez, 2023). However, these private databases often restrict data access and may require extensive research proposals for data retrieval. Among these databases commonly used databases are Heidelberg University Hospital (Jung et al., 2023), COMBO-01 (Zhou et al., 2023), Life cohort (Unterhuber et al., 2021), and UNOS (Kantidakis et al., 2020; Raju and Sathyalakshmi, 2023). The reliance on private databases for survival prediction creates significant hurdles for research in several ways (Raufaste-Cazavieille et al., 2022). Firstly, limited accessibility to such data impedes the reproducibility and verification of study findings by other researchers, hindering the validation and robustness of predictive models (Misra et al., 2019). Secondly, the lack of transparency and standardized access procedures for private datasets introduces challenges in benchmarking and comparing different survival prediction models (Raufaste-Cazavieille et al., 2022). Lastly, the exclusivity of private databases may contribute to a potential bias in research outcomes, as the diversity and representativeness of the data are often compromised which impacts the generalizability of survival predictions to broader patient cohorts (Boffa et al., 2021).
Public access to databases enables researchers to create survival benchmark datasets that fosters the development of survival prediction models (Liu et al., 2018; Rahimi et al., 2023). However, many researchers develop datasets without making them public which hinders transparency and the broader scientific community progress (Weston et al., 2019). The lack of shared data and presence of multiple datasets associated with a single disease pose a notable challenge in survival prediction. For instance, it hinders the establishment of standardized testing and benchmarking procedures for newly proposed survival prediction methods, leading to ambiguities in identifying the most advanced techniques (Wissel et al., 2022). Moreover, recognizing the need for standardization in benchmarking survival prediction models, Wissel et al. (2022) introduced benchmark survival datasets tailored for both individual cancer subtypes and pan-cancer settings. These datasets are accessible at https://survboard.vercel.app/, contributing to a more uniform and transparent benchmarking framework within the survival prediction landscape. Particularly, here we emphasize the use of these datasets for benchmarking in addition to newly created datasets to have unified benchmarking for cancer-specific survival prediction models.
5.3 RQ V, VI: survival prediction data modalities and utilization of their combinations for disease and survival endpoints specific predictors development
Following the objective of research question V, the primary focus of this section is to investigate and provide a comprehensive summary of the various data modalities utilized in the development of diverse survival predictors. To address research question V, it describes the distribution of data modalities across predictors associated with four distinct survival endpoints, and 44 different diseases. Furthermore, in response to research question VI, it furnishes information regarding the specific clinical features utilized by various survival prediction studies.
Out of 90 different studies, data modalities details of only 84 studies are available. Within this subset, 27 studies exclusively used clinical data, 39 studies utilized multiomics data, and 16 studies investigated the combined potential of both clinical and multiomics data modalities. Moreover, based on characteristics of molecular information omics data is generally categorized into nine different classes namely gene expression (mRNA), micro RNA (miRNA), methylation, copy number variation (CNV), whole exome sequencing (WES), long noncoding RNA (lncRNA), mutation, metabolic, and proteomics. The specifics of different predictors, in terms of variations in the combinations of clinical and various omics data modalities, are outlined in Table 5. Among 55 survival prediction studies based on multiomics, 49 studies utilized different combinations of four distinct omics types: mRNA, methylation, miRNA, and CNV (Baek and Lee, 2020; Jiang et al., 2020; Li et al., 2020; Tan et al., 2020; Tong D. et al., 2020; Tong L. et al., 2020; Yang Q. et al., 2020; Chai et al., 2021a; Hira et al., 2021; Hu Q. et al., 2021; Owens et al., 2021; Tong et al., 2021; Zhang X. et al., 2021; Zhang Z.-S. et al., 2021; Zhao L. et al., 2021; Bhat and Hashmy, 2023; Ellen et al., 2023; Hao et al., 2023). Only seven studies utilized additional modalities such as whole exome sequencing (WES) (Baek and Lee, 2020; Jiang et al., 2022), long coding RNA (lncRNA) (Jiang et al., 2022), proteomics (Tan et al., 2020; Malik et al., 2021; Unterhuber et al., 2021; Richard et al., 2022; Pellegrini, 2023), and mutation data (Tan et al., 2020; Malik et al., 2021; Unterhuber et al., 2021; Pellegrini, 2023).
Table 5.
Distribution of data modalities across diverse surival prediction studies.
| Data modality | References | ||||||||||||||||||||||||||||||||||||||||
|---|---|---|---|---|---|---|---|---|---|---|---|---|---|---|---|---|---|---|---|---|---|---|---|---|---|---|---|---|---|---|---|---|---|---|---|---|---|---|---|---|---|
| Pellegrini (2023) | Jung et al. (2023) | Qian et al. (2023) | Chauhan et al. (2023) | Li et al. (2023) | Moreno-Sanchez (2023) | Wang J. et al. (2023) | Zhou et al. (2023) | Zhang et al. (2023) | Hao et al. (2023) | Lee et al. (2023) | Wang X. et al. (2023) | Zhang S. et al. (2022) | Manganaro et al. (2023) | Benkirane et al. (2023) | Othman et al. (2023) | Bhat and Hashmy (2023) | Fan et al. (2023) | Willems et al. (2023) | Ellen et al. (2023) | Yin et al. (2022) | Richard et al. (2022) | Wang et al. (2022) | Zhang J. Z. et al. (2022) | Miao et al. (2022) | Li et al. (2021) | Zhang Z.-S. et al. (2021) | Zhou et al. (2021) | Zhang X. et al. (2021) | Zheng et al. (2021) | Li et al. (2020) | Kazerooni et al. (2021) | Lv et al. (2020) | Jiang et al. (2020) | Zarean Shahraki et al. (2023) | Doja et al. (2020) | Pant et al. (2023) | Hu S. et al. (2021) | Eckardt et al. (2023) | Zhu et al. (2023) | Rahman et al. (2023) | |
| Clinical | ✓ | ✓ | ✓ | ✓ | ✓ | ✓ | ✓ | ✓ | × | × | ✓ | × | ✓ | ✓ | × | ✓ | ✓ | ✓ | × | ✓ | × | × | × | × | ✓ | ✓ | × | × | × | × | × | ✓ | × | × | ✓ | ✓ | ✓ | ✓ | ✓ | ✓ | ✓ |
| mRNA | ✓ | × | × | × | × | × | × | × | × | ✓ | ✓ | ✓ | ✓ | ✓ | ✓ | ✓ | ✓ | ✓ | ✓ | ✓ | ✓ | × | ✓ | ✓ | × | ✓ | ✓ | ✓ | ✓ | × | ✓ | × | ✓ | ✓ | × | × | × | × | × | × | × |
| miRNA | × | × | × | × | × | × | × | × | ✓ | ✓ | × | × | × | × | × | × | ✓ | ✓ | ✓ | ✓ | × | × | × | × | × | ✓ | ✓ | × | ✓ | ✓ | × | × | ✓ | ✓ | × | × | × | × | × | × | × |
| Methylation | ✓ | × | × | × | × | × | × | × | × | ✓ | × | × | × | × | ✓ | × | ✓ | × | × | ✓ | × | × | ✓ | ✓ | × | ✓ | ✓ | × | ✓ | × | ✓ | × | ✓ | ✓ | × | × | × | × | × | × | × |
| CNV | × | × | × | × | × | × | × | × | × | × | ✓ | × | ✓ | ✓ | ✓ | ✓ | ✓ | ✓ | × | × | × | × | × | × | × | × | × | ✓ | × | ✓ | × | × | × | ✓ | × | × | × | × | × | × | × |
| Proteomics | ✓ | × | × | × | × | × | × | × | × | × | × | × | × | × | × | × | × | × | × | × | × | ✓ | × | × | × | × | × | × | × | × | × | × | × | × | × | × | × | × | × | × | × |
| Mutation | × | × | × | × | × | × | × | × | × | × | × | × | ✓ | ✓ | × | × | × | × | × | × | × | × | × | × | × | × | × | × | × | ✓ | × | × | × | × | × | × | × | × | × | × | × |
| Metabolic | × | × | × | × | × | × | × | × | × | × | × | × | × | × | × | × | × | × | × | × | × | ✓ | × | × | × | × | × | × | × | × | × | × | × | × | × | × | × | × | × | × | × |
| lncRNA | × | × | × | × | × | × | × | × | × | × | × | × | × | × | × | × | × | × | × | × | × | × | × | × | × | × | × | × | × | × | × | × | × | × | × | × | × | × | × | × | × |
| WES | × | × | × | × | × | × | × | × | × | × | × | × | × | × | × | × | × | × | × | × | × | × | × | × | × | × | × | × | × | × | × | × | × | × | × | × | × | × | × | × | × |
| Data modality | References | ||||||||||||||||||||||||||||||||||||||||
| Lin et al. (2022) | Feng et al. (2022) | Bichindaritz and Liu (2022) | Wu et al. (2022) | Jiang et al. (2022) | Zhang R. et al. (2022) | Wu and Fang (2022) | Hathaway Q. A. et al. (2021) | Pawar et al. (2022) | Redekar et al. (2022) | Han et al. (2022) | Zeng et al. (2021) | Unterhuber et al. (2021) | Hu Q. et al. (2021) | Poirion et al. (2021) | Kantidakis et al. (2020) | Zhao L. et al. (2021) | Chai et al. (2021a) | Tang et al. (2021) | Vahabi et al. (2021) | Malik et al. (2021) | Owens et al. (2021) | Hira et al. (2021) | Tong et al. (2021) | Du et al. (2020) | Yu et al. (2020) | Yang Q. et al. (2020) | Wang et al. (2020) | Yang H. et al. (2020) | Baek and Lee (2020) | Tong L. et al. (2020) | Tong D. et al. (2020) | Tan et al. (2020) | Lee et al. (2020) | Palmal et al. (2023) | Lun et al. (2024) | Wang Q. et al. (2023) | Lang et al. (2023) | Farahani et al. (2023) | Fala and Osman (2023) | Tarango et al. (2023) | |
| Clinical | ✓ | ✓ | ✓ | × | × | × | × | ✓ | × | ✓ | × | ✓ | ✓ | × | × | ✓ | ✓ | × | × | × | × | × | × | × | × | × | × | × | × | ✓ | × | ✓ | × | × | ✓ | × | × | × | × | × | × |
| mRNA | × | × | ✓ | ✓ | ✓ | ✓ | ✓ | × | ✓ | ✓ | ✓ | × | × | ✓ | ✓ | × | ✓ | ✓ | ✓ | ✓ | ✓ | ✓ | ✓ | ✓ | ✓ | ✓ | ✓ | ✓ | ✓ | ✓ | ✓ | ✓ | ✓ | ✓ | ✓ | × | × | × | × | × | × |
| miRNA | × | × | × | × | ✓ | × | × | × | × | × | × | × | × | ✓ | ✓ | × | ✓ | ✓ | × | × | × | ✓ | ✓ | ✓ | × | × | × | ✓ | ✓ | ✓ | ✓ | ✓ | ✓ | ✓ | × | × | × | × | × | × | × |
| Methylation | × | × | ✓ | ✓ | ✓ | × | × | × | × | ✓ | ✓ | × | × | ✓ | ✓ | × | ✓ | ✓ | × | ✓ | ✓ | ✓ | ✓ | ✓ | × | ✓ | × | ✓ | ✓ | ✓ | ✓ | ✓ | ✓ | ✓ | × | × | × | × | × | × | × |
| CNV | × | × | × | × | × | ✓ | ✓ | × | × | ✓ | ✓ | × | × | ✓ | × | × | ✓ | ✓ | × | × | ✓ | × | ✓ | ✓ | ✓ | × | × | × | × | × | ✓ | × | × | ✓ | ✓ | × | × | × | × | × | × |
| Proteomics | × | × | × | × | × | × | × | × | × | × | × | × | ✓ | × | × | × | × | × | × | × | ✓ | × | × | × | × | × | × | × | × | × | × | × | ✓ | × | × | × | × | × | × | × | × |
| Mutation | × | × | × | × | × | × | × | × | × | × | ✓ | × | × | ✓ | × | × | × | × | × | × | ✓ | × | × | × | × | × | ✓ | × | × | × | × | × | × | × | × | × | × | × | × | × | × |
| Metabolic | × | × | × | × | × | × | × | × | × | × | × | × | × | × | × | × | × | × | × | × | × | × | × | × | × | × | × | × | × | × | × | × | × | × | × | × | × | × | × | × | × |
| lncRNA | × | × | × | × | ✓ | × | × | × | × | × | × | × | × | × | × | × | × | × | × | × | × | × | × | × | × | × | × | × | × | × | × | × | × | × | × | × | × | × | × | × | × |
| WES | × | × | × | × | ✓ | × | × | × | × | × | × | × | × | × | × | × | × | × | × | × | × | × | × | × | × | × | × | × | × | ✓ | × | × | × | × | × | × | × | × | × | × | × |
The choice of omics type hinges on the specific disease under investigation, as indicated by the disease-wise distribution of omics types in Figure 6. Out of nine omics types, mRNA, CNV, miRNA, and methylation have been the most commonly utilized modalities for 33 cancer subtypes i.e., breast cancer (Tong L. et al., 2020; Malik et al., 2021; Zhou et al., 2021; Wu and Fang, 2022; Zhang J. Z. et al., 2022; Hao et al., 2023; Othman et al., 2023; Zhang et al., 2023), pan-cancer (Tan et al., 2020; Poirion et al., 2021; Zhang X. et al., 2021; Zheng et al., 2021; Redekar et al., 2022; Yin et al., 2022; Fan et al., 2023), colon cancer (Lv et al., 2020; Tong D. et al., 2020; Yang H. et al., 2020; Zhang J. Z. et al., 2022; Lee et al., 2023), lung adenocarcinoma (Jiang et al., 2020; Lee et al., 2020; Bhat and Hashmy, 2023), and ovarian cancer (Hira et al., 2021; Tong et al., 2021; Zhao L. et al., 2021; Pawar et al., 2022; Wu and Fang, 2022; Zhang S. et al., 2022). In addition, mutation data has been utilized for seven cancer subtypes namely, adult diffuse glioma (Yang Q. et al., 2020), breast cancer (Malik et al., 2021), cervical cancer (Hu Q. et al., 2021), non-small cell lung cancer (Manganaro et al., 2023), ovarian cancer (Zhang S. et al., 2022), and pancreatic cancer (Han et al., 2022). Among 10 data modalities, three modalities namely, proteomic, lncRNA and WES have been utilized the least having limited applicability to clear renal cell cancer (Jiang et al., 2022), pancreatic cancer (Baek and Lee, 2020), breast cancer (Malik et al., 2021), localized prostate cancer (Pellegrini, 2023), and pan-cancer (Zheng et al., 2021). In terms of other diseases i.e., COVID-19 and heart diseases, proteomics, methylation, mRNA, metabolic, and methylation have been the only omics types utilized for survival prediction (Unterhuber et al., 2021; Vahabi et al., 2021; Richard et al., 2022).
Figure 6.

Distribution of omics data modalities across a diverse set of diseases. Bar heights represent the counts of each data modality with respect to disease specific published research papers. For instance, CNV has been used in six papers related to breast cancer, mRNA has been used in seven breast cancer papers and so on.
The variability in omics-type selection is not solely bound to diseases but notably varies across a wide spectrum of survival endpoints. Figure 7 shows the counts of different omics types that have been utilized for different survival endpoints prediction. In the context of OS prediction, mRNA, miRNA, methylation, and CNV have been primarily utilized in more than 31 studies, with 10 studies based on proteomics, mutation, and metabolic data. However, in terms of DFS and PFS the selection of omics types appears less distinct. These endpoints have been frequently studied in conjunction with OS, predominantly utilizing mRNA, miRNA, and methylation data. This combination suggests a commonality in the predictive factors across these survival endpoints, indicating potential interconnections or shared biological processes.
Figure 7.

Distribution of different omics modalities with respect to survival endpoints.
Clinical data modality has been utilized in 42 different studies. However, in this modality number of features varied from study to study and it is still unclear which particular set of features is most important. To perform an in-depth analysis, which study utilized which subset of features across diverse cancer subtypes and heart diseases, a comprehensive collection of clinical features is presented in Table 6. In order to better understand and discern the trends in clinical features across diverse diseases, hereby they are placed in seven different categories i.e., demographic features (6), disease-specific clinical markers (71), treatment-related features (17), laboratory and biomarkers (48), comorbidity and lifestyle factors (18), and other factors (15).
Table 6.
Diverse collection of clinical features utilized in various survival prediction studies.
| References | Disease | Total | Features (generic) |
|---|---|---|---|
| Qian et al. (2023) | Atherosclerotic cardiovascular disease (ASCVD) | 39 | Height, weight, waist and hip circumference, blood pressure, B-ultrasound, heart rate, hypertension, prehypertension, pulse pressure difference, body mass index, body obesity index, waist to hip ratio, composite index triglyceride, blood glucose index, fat accumulation product index, lipoprotein binding index, atherosclerosis index, atherogenic index of plasma, low high density lipoprotein ratio, bilirubin composite index, family history of diseases of diabetes or ASCVD, smoking, alcohol consumption, fasting blood glucose, triglyceride, high-density lipoprotein cholesterol, total cholesterol, low-density lipoprotein cholesterol, diabetes, fatty liver, blood glucose index, fat accumulation product index, lipoprotein binding index, atherosclerosis index, AIP, low–high-density lipoprotein ratio and bilirubin composite index |
| Pellegrini (2023) | Localized prostate cancer | 24 | Prostate-specific antigens, Gleason primary score, tumor stage expression levels for NF2 and CDKN1B |
| Jung et al. (2023) | Gastroesophageal cancer | 117 | Biometric variables, past medical history of diseases, tumor diagnosis, cTNM classification, histology, neoadjuvant therapy, time between diagnosis and resection, type of operation, extent of resection, anatomical reconstruction, duration of surgery, intraoperative complication, blood loss and transfusion, days on ICU and ward, postoperative complications, pTNM classification, lymph node ratio, grading, r status, histology, post-discharge problems |
| Chauhan et al. (2023) | Bladder cancer | 17 | Gender, median age, ethnicity, smoking history, initial tumor stage, neoadjuvant chemotherapy received, histology, pathology, pathologic complete response, smoking history, pack years, body mass index, hemotocrit, urine cfDNA, variant allele frequency, inferred tumor mutational burden, tumor fraction |
| Li et al. (2023) | Lymphoma | 18 | Sex, age at diagnosis, ethnic, medical insurance, Ann Arbor stage, pathological type, b symptoms, surgery, radiotherapy, chemotherapy, targeted therapy, immunotherapy, LDH, β2-microglobulin, platelet, lymphocyte, albumin globulin ratio and C reactive protein |
| Lee et al. (2023) | Colon cancer | 7 | Age, sex, AJCC stage, prognostic information such as alive, deceased, disease free and recurrence |
| Wang X. et al. (2023) | Hepatocellular carcinoma | 24 | Age, gender, ALT, main tumor size, multinodular, cirrhosis, TNM stage, BCLC stage, CLIP stage, tumor grade, TMB, stromal score, immune score, ESTIMATE score, risk score, CNLC stage, hepatitis B, Lymph node invasion, vascular invasion, perineural invasion, albumin, AFP, CEA and CA199 |
| Manganaro et al. (2023) | Non-small cell lung cancer | 6 | Histology, gender, age, pathological staging, DFS, and smoking status related features |
| Othman et al. (2023) | Breast cancer | 25 | Age at diagnosis, tumor size, tumor stage, lymph nodes, examined positive neoplasm, histologic grade, histological type, ER status, PR status, HER2 SNP6 state, type of treatment, the patient received survival status and time, inferred menopausal state, overall survival, HER2 SNP6 state, treatment and patients vital status |
| Moreno-Sanchez (2023) | Heart failure | 13 | Age, anemia, high blood pressure, creatinine phosphokinase, diabetes, ejection fraction, sex, platelets, serum creatinine, serum sodium, smoking, time follow up period and death event |
| Wang J. et al. (2023) | Metastatic breast cancer | 10 | Age at diagnosis, mean age, molecular classification (luminal, triple-negative), de novo metastasis, number of metastatic sites, visceral metastases, adjuvant chemotherapy, adjuvant radiotherapy, adjuvant endocrine therapy and previous endocrine therapy |
| Ellen et al. (2023) | Non-small lung cancer | 11 | Age, sex, tumor, volume, primary diagnosis, prior malignacy, synchronous malignancy, pathological stage, staging tumor, staging lymph nodes, staging metastasis, no. of pack-years smoked |
| Miao et al. (2022) | Nasopharyngeal carcinoma | 17 | Age, stage, sex, ethnicity, marriage, occupation, pathological, transfer information, radiotherapy, chemical therapy, targeted therapy, EBV, BQ, LAR, NLR and PLR |
| Feng et al. (2022) | Cardiovascular | 8 | Age, age groups, sex, region of residence, number of Charlson comorbidities, Charlson comorbidities, lab test results(LDL-cholesterol, blood glucose, eGFR, HbA1c, at least one lab test), features related to medications |
| Bichindaritz and Liu (2022) | Esophageal carcinoma | 3 | Vital status, days to death and days to last follow up |
| Redekar et al. (2022) | Glioblastoma multiforme | 9 | Age, gender, diagnosis method, treatment history, Karnofsky score, performance score, radiation therapy, duration of survival and death status |
| Unterhuber et al. (2021) | Cardiovascular disease | 12 | Age, sex, body mass index, smoking status, systolic and diastolic blood pressure, current smoker, total cholesterol, HDL cholesterol, triglycerides, lipid lowering drug dose, antihypertensive drug use and median follow-up time |
| Hathaway Q. A. et al. (2021) | Atherosclerosis | 33 | Age, albumin/creatinine ratio, BMI, cholesterol, diabetes, educational status, family history of heart diseases, gender, HDL, hyperlipidemia, hypertension, income category, LDL, mean diastolic and systolic blood pressure, metabolic syndrome, smoking in past years, statin use, triglycerides, minutes walking per week, c reactive protein, D dimer, factor VIII, fibrinogen antigen, homocysteine, interleukin-6, plasmin antiplasmin, pericardial fat deposition, coronary artery calcium score, left ventricular area and left ventricular ejection fraction |
| Zhao L. et al. (2021) | Multiple cancer subtypes | 3 | Age, Overall Survival time, Status |
| Li et al. (2021) | Prostate cancer | 4 | Age at diagnosis, clinical tumor stage (T1(a-c),T2(a-c), T3(a-b),T4), NA Gleason score and preoperative PSA |
| Kantidakis et al. (2020) | Liver transplantation | 97 | 52 donor and 45 liver recipient characteristics, unique encrypted person Id, unique encrypted donor Id, candidate listing center, OPO serving, transplant center, transplant date, graft failure date, cohort censoring date, death date, graft follow up date, age, gender, race, ethnicity, socioeconomic status and education level, smoking history, alcohol consumption, physical activity level, cocaine or other drug history, blood type, etiology (cause of disease), laboratory measurements for arginine, serum creatinine, serum sodium, total bilirubin |
| Baek and Lee (2020) | Pancreatic adenocarcinoma (PAAD) | 7 | Sex, grade, AJCC cancer stage, smoking history, treatment outcome, age, primary site |
| Tong D. et al. (2020) | Colon cancer | 7 | Gender, survival status, survival time, TNM stage, age at initial diagnosis |
A closer look at the clinical features across diverse diseases reveals a consistent set of fundamental demographic features i.e., age and gender which are prevalent in nearly all studies (Hathaway Q. A. et al., 2021; Unterhuber et al., 2021; Feng et al., 2022; Redekar et al., 2022; Li et al., 2023; Wang X. et al., 2023). Beyond demographic features, disease-specific features also play critical role for disease-specific survival prediction. For instance, cancer-related studies invariably focus on tumor stage, histological type, and treatment specifics, underlining the critical role of disease-specific clinical markers in prognosis (Lee et al., 2023; Pellegrini, 2023).
Treatment-related features such as chemotherapy, radiotherapy, and immunotherapy, are particularly evident in cancer subtypes specific studies which reflect the profound influence of therapeutic interventions on survival outcomes (Othman et al., 2023; Wang X. et al., 2023). Moreover, the recurrent inclusion of lifestyle and comorbidity factors ranging from smoking history and BMI to hypertension and diabetes across multiple diseases underlines their pervasive impact on prognostic modeling (Hathaway Q. A. et al., 2021; Bhat and Hashmy, 2023). These lifestyle and comorbidity features show the complex relationship between individual health choices and their potential influence on survival outcomes.
5.4 RQ VII: feature engineering trends across data modalities and disease-specific survival predictors
This section addresses research question VII by investigating the application of feature engineering methods in survival prediction studies across a variety of diseases. This will help researchers to analyze and understand trends of feature engineering techniques in disease or endpoint specific survival prediction pipelines. Additionally, it delves into the trends in diverse feature engineering methods and their relevance to clinical and multiomics data modalities. This investigation aims to reveal trends and patterns in the dynamic interplay between feature engineering methods and the specific characteristics of different data modalities, and survival endpoints.
Table 7 illustrates 30 different feature engineering methods that have been utilized in diverse survival prediction studies. These methods are broadly categorized into five categories, namely supervised methods, incorporating L1 regularized Cox regression (Qian et al., 2023), RSF algorithm (Qian et al., 2023), Cox regression (Zhang S. et al., 2022), least absolute shrinkage and selection operator (lasso) regression (Abdelhamid et al., 2022), cascaded Wx (Yin et al., 2022), recursive feature elimination (Wang et al., 2022), Boruta (Jiang et al., 2022), Akaike information criterion (AIC) regression (Zeng et al., 2021), variance (Zhao L. et al., 2021), lasso analysis (Tang et al., 2021), multivariate regression (Tang et al., 2021), Chi-squared (Moreno-Sanchez, 2023), mutual information (Moreno-Sanchez, 2023), and ANOVA (Lv et al., 2020; Moreno-Sanchez, 2023). Additionally, Network based methods include network based stratification (NBS) (Shetty et al., 2023), weighted correlation network analysis (WGCNA) (Wang X. et al., 2023), canonical correlation analyses (CCA) (Wang J. et al., 2023), patient similarity networks (Wang et al., 2022), and neighborhood component analysis (NCA) (Malik et al., 2021). Dimensionality reduction methods include non-negative matrix factorization (NMF) (Tang et al., 2021), autoencoders (AEs) (Benkirane et al., 2023), variational autoencoders (VAEs) (Owens et al., 2021), principal component analysis (PCA) (Lv et al., 2020), and dominant effect of the cancer driver genes (DEOD) (Amgalan and Lee, 2015; Lee et al., 2023). Moreover, clustering methods comprise Kruskal-Wallis and Gaussian clustering (Poirion et al., 2021), hierarchical clustering (Chai et al., 2021a), and Guassian clustering (Poirion et al., 2021). In addition, to deal with clinical data, Palmal et al. (2023) showed the application of Tab-transformer for feature extraction.
Table 7.
Diverse feature engineering methods for survival prediction.
| Method name | References |
|---|---|
| L1 regularized Cox regression | Qian et al., 2023 |
| RSF algorithm | Qian et al., 2023 |
| Cox regression | Zhang S. et al., 2022; Qian et al., 2023 |
| Network-Based Stratification (NBS) for data integration | Shetty et al., 2023 |
| Weighted correlation network analysis (WGCNA) | Wang X. et al., 2023 |
| Canonical correlation analyses (CCA) | Wang J. et al., 2023 |
| Least Absolute Shrinkage and Selection Operator (lasso) regression modeling | Abdelhamid et al., 2022; Eckardt et al., 2023 |
| Cascaded Wx | Yin et al., 2022 |
| Recursive feature elimination | Wang et al., 2022; Eckardt et al., 2023 |
| Patient similarity networks | Wang et al., 2022 |
| Boruta | Jiang et al., 2022 |
| Akaike Information Criterion (AIC) regression | Zeng et al., 2021 |
| Kruskal-Wallis and Gaussian clustering | Poirion et al., 2021 |
| Variance | Zhao L. et al., 2021 |
| Non-negative matrix factorization (NMF) | Tang et al., 2021 |
| Lasso analysis | Tang et al., 2021 |
| Multivariate regression | Tang et al., 2021 |
| PCA | Lv et al., 2020; Chai et al., 2021a; Jiang et al., 2022; Zhang S. et al., 2022 |
| ANOVA | Lv et al., 2020; Moreno-Sanchez, 2023 |
| Chi-squared | Eckardt et al., 2023; Moreno-Sanchez, 2023 |
| Mutual information | Moreno-Sanchez, 2023 |
| Hierarchical clustering | Tong D. et al., 2020; Chai et al., 2021a |
| Neighborhood component analysis (NCA) | Malik et al., 2021 |
| DEOD | Lee et al., 2023 |
| Minimal-redundancy-maximal-relevance criterion (MRMR) | Palmal et al., 2023 |
| Graph convolution Networks | Palmal et al., 2023 |
| Tab-transformer | Pant et al., 2023 |
| Transformer | Hu S. et al., 2021 |
| Variational autoencoders | Tong L. et al., 2020; Hira et al., 2021; Zhang X. et al., 2021; Benkirane et al., 2023; Bhat and Hashmy, 2023 |
| Autoencoders | Baek and Lee, 2020; Jiang et al., 2020, 2022; Li et al., 2020; Lv et al., 2020; Wang et al., 2020; Yang H. et al., 2020; Owens et al., 2021; Wu and Fang, 2022 |
A comprehensive analysis of feature engineering methods across a range of disease-specific survival prediction studies unveils that supervised methods, such as Cox regression, L1 regularized Cox regression, and RSF algorithm, have been prevalent in diseases like ASCVD, trauma, and ovarian cancer (Abdelhamid et al., 2022; Zhang S. et al., 2022). On the other hand, network based methods including NBS and WGCNA, have been applied in diseases like KIRP, and hepatocellular carcinoma, which shows the significance of network structures in certain medical contexts (Wang X. et al., 2023). Univariate analyses, including ANOVA, chi-squared, and univariate Cox regression, have been prevalent in diseases such as pancreatic cancer and heart failure, underscoring the significance of statistical testing in identifying relevant features (Moreno-Sanchez, 2023; Zhou et al., 2023). Furthermore, dimensionality reduction methods such as PCA, and NMF have been consistently used across various diseases namely, ovarian cancer (Zhang S. et al., 2022), lower grade glioma (Wu et al., 2022), colon adenocarcinoma (Lv et al., 2020), bladder and breast cancers (Tang et al., 2021; Lin et al., 2022). In addition, the potential of AEs, and VAEs have also been explored in diseases like glioblastoma multiforme, breast cancer, pan-cancer, and Lung Adenocarcinoma for feature integration and dimensionality reduction (Benkirane et al., 2023; Bhat and Hashmy, 2023; Hao et al., 2023).
While feature engineering methods exhibit specificity tailored to distinct diseases, their efficacy is influenced by the inherent characteristics of the utilized data (Jiang et al., 2017). This raises the pertinent question of which particular feature engineering method proves most effective in the context of clinical and multiomics datasets. A thorough analysis of feature engineering methods and their applicability with respect to clinical and multiomics datasets reveals that methods like Cox regression, CCA, AIC, and ANOVA have been quite widely utilized in studies involving only clinical data (Zeng et al., 2021; Moreno-Sanchez, 2023; Qian et al., 2023; Wang J. et al., 2023). These methods have been applied to clinical data for multiple reasons for instance, such methods are interpretable which is important to gain meaningful insights for healthcare professionals (Jiang, 2022). Clinical data is always multifactorial, which means that multiple features of the data can lead to a specific event, and methods like ANOVA are quite efficient in analyzing such contributors (Azizi et al., 2022). Although, such models have shown promising performance with clinical data, yet one of the drawbacks of such models is their inability to handle non-linear data which is the case in terms of multiomics data (Cleves, 2008). Considering similar limitations, multiple methods such as cascaded wx (Yin et al., 2022), RFI (Wang et al., 2022), PSN (Jiang et al., 2022), NMF (Tang et al., 2021), Boruta (Jiang et al., 2022), PCA (Chai et al., 2021a) variance (Zhao L. et al., 2021), DEOD (Lee et al., 2023), have been utilized to handle multiomics to capture important interactions among the features and to integrate cross modalities properly. Particularly, here methods such as AEs and VAEs play a significant role and recent studies also show a growing interest in using such methods for dimensionality reduction and feature integration by such methods for multiomics and clinical datasets i.e., AEs (Baek and Lee, 2020; Jiang et al., 2020, 2022; Li et al., 2020; Lv et al., 2020; Wang et al., 2020; Yang H. et al., 2020; Owens et al., 2021; Wu and Fang, 2022), and VAEs (Tong L. et al., 2020; Hira et al., 2021; Zhang X. et al., 2021; Benkirane et al., 2023).
Although the selection of a feature engineering method is tied to the characteristics of the disease and the nature of the data (Dong and Liu, 2018), there is no significant evidence to suggest that it is substantially impacted by survival endpoints such as DFS, PFS, BC, and OS. This assumption arises due to the absence of a consistent pattern in feature engineering method selection across different survival endpoints. Studies, such as Lv et al. (2020), Tang et al. (2021), and Manganaro et al. (2023), demonstrate a varied use of feature engineering techniques irrespective of the specific survival endpoints (DFS, PFS, BC, or OS). This lack of uniformity implies that feature engineering method selection is driven more by the unique characteristics of the data and disease than by the nature of the survival endpoint itself.
On the basis of various trends and patterns it can be concluded that for heart diseases, univariate analyses and supervised feature engineering methods have been utilized. Conversely, in terms of cancer subtypes a mixture of dimensionality reduction methods is observed with a recent trend toward the AEs. In terms of survival datasets, the prime focus has been to use supervised methods for clinical data and multiple dimensionality reduction methods for multiomics data. Moreover, there are no conclusive remarks that feature engineering methods get affected by the survival endpoints, as the current literature also suggests a varied use of feature engineering methods regardless of the survival endpoints.
5.5 RQ VIII: survival prediction methods insights and distribution across disease types and survival endpoints
In pursuit of addressing research question VIII, this section presents an overview and insights about statistical, ML, and DL algorithms that have been utilized in existing survival prediction pipelines. It succinctly examines their emerging trends across diseases and survival endpoints. This exploration aims to empower researchers in identifying gaps within disease-specific and survival endpoint-focused studies, ultimately contributing to the enhancement of survival predictive pipelines.
Table 8 provides information about 44 diseases and the corresponding survival prediction algorithms utilized in these diseases. A deeper analysis of Table 8 shows that Cox-PH and lasso Cox-PH models have been extensively utilized for disease specific survival prediction i.e., ASCVD (Hathaway Q. A. et al., 2021; Qian et al., 2023), bladder cancer (Chai et al., 2021a; Tang et al., 2021), colorectal cancer (Tong D. et al., 2020; Yang H. et al., 2020; Zhang J. Z. et al., 2022; Lee et al., 2023), hepatocellular carcinoma (Owens et al., 2021; Zhang R. et al., 2022; Wang X. et al., 2023), ovarian cancer (Hira et al., 2021; Pawar et al., 2022; Wu and Fang, 2022; Zhang S. et al., 2022), lung adenocarcinoma (Bhat and Hashmy, 2023), heart failure (Moreno-Sanchez, 2023), HER2-negative metastatic breast cancer (Wang J. et al., 2023), pancreatic cancer (Baek and Lee, 2020; Zhou et al., 2023), trauma (Abdelhamid et al., 2022), nasopharyngeal carcinoma (Miao et al., 2022), triple-negative breast cancer (Zhang et al., 2023), lymphoma (Li et al., 2023), breast cancer (Chai et al., 2021a; Tang et al., 2021; Chauhan et al., 2023), ovarian cancer (Hira et al., 2021; Pawar et al., 2022; Wu and Fang, 2022; Zhang S. et al., 2022), and lower-grade glioma (Wu et al., 2022), cardiovascular disease (Unterhuber et al., 2021; Vahabi et al., 2021; Xu et al., 2021; Zeng et al., 2021; Feng et al., 2022), invasive ductal carcinoma (Lin et al., 2022), liver transplantation (Kantidakis et al., 2020), gastric cancer (Li et al., 2020), lung cancer (Jiang et al., 2020), esophageal squamous cell carcinoma (Yu et al., 2020), glioma (Yang Q. et al., 2020), and liver cancer (Wang et al., 2020). RSF has been employed in 13 studies for six diseases namely, ASCVD (Qian et al., 2023), bladder cancer (Chai et al., 2021a), gastrointestinal cancer (Jung et al., 2023), cervical cancer (Hu Q. et al., 2021), liver transplantation (Kantidakis et al., 2020), and heart failure (Moreno-Sanchez, 2023). DL model DeepSurv, has been utilized in five studies related to gastrointestinal cancer (Jung et al., 2023), ASCVD (Hathaway Q. A. et al., 2021), NSCLC (Zhang Z.-S. et al., 2021). On the other hand, in the analyzed survival predictive pipelines less frequently utilized methods are i.e., survival SVM (Yu et al., 2020; Abdelhamid et al., 2022; Manganaro et al., 2023), partial logistic regression (Lin et al., 2022; Lee et al., 2023), log hazard net (Lee et al., 2023; Majji et al., 2023), boosting (Wang et al., 2020; Feng et al., 2022), stepCox (Wang X. et al., 2023), elastic net (Manganaro et al., 2023), CNN-cox (Majji et al., 2023), DeepOmix (Majji et al., 2023), ordinal Cox-PH (Bichindaritz and Liu, 2022), DeepHit (Feng et al., 2022), and linear multitask logistic regression (MTLR) (Feng et al., 2022).
Table 8.
Distribution of survival predictors across diverse diseases.
| References | Disease | Predictor |
|---|---|---|
| Hathaway Q. A. et al. (2021), Qian et al. (2023) | ASCVD | Cox-PH, RSF, MTLR, Deepsurv neural network, lasso Cox-PH |
| Hao et al. (2023), Shetty et al. (2023) | KIRP | GeneNet, ANNs |
| Li et al. (2021), Pellegrini (2023) | Prostate cancer | Coherent Voting Network (CVN), Best Linear Unbiased Prediction (BLUP) |
| Jung et al. (2023) | Gastrointestinal cancer | DeepSurv, MTLR, Gompertz model, RSF |
| Zhang et al. (2023) | Tripple negative breast cancer | lasso Cox-PH |
| Chai et al. (2021a), Tang et al. (2021), Chauhan et al. (2023) | Bladder cancer | Cox-PH, RSF, CoxNet, and transfer learning-based CoxNet |
| Li et al. (2023) | Lymphoma | lasso-Cox-PH |
| Tong D. et al. (2020), Yang H. et al. (2020), Zhang J. Z. et al. (2022), Lee et al. (2023) | Colon cancer | Loghazard Net, partial logistic regression, Cox-PH |
| Owens et al. (2021), Zhang R. et al. (2022), Wang X. et al. (2023) | Hepatocellular carcinoma | Stepwise Cox (StepCox), SurvivalSVM, Cox-PH, CoxNet |
| Hira et al. (2021), Pawar et al. (2022), Wu and Fang (2022) Zhang S. et al. (2022) | Ovarian cancer | Cox-PH, Cox-Time, and DeepSurv with consensus training |
| Zhang Z.-S. et al. (2021), Ellen et al. (2023), Manganaro et al. (2023) | NSCLC | SVM, Elastic net and Cox-PH, CNN and ANN |
| Benkirane et al. (2023) | Multiple cancers | ANN |
| Tong L. et al. (2020), Malik et al. (2021), Wu and Fang (2022), Othman et al. (2023) | Breast cancer | CoxNet, Cox-PH, Cox-Time, and DeepSurv with consensus training, Loghazard Net, partial logistic regression |
| Bhat and Hashmy (2023) | Lung adenocarcinoma | Cox-PH, and lasso Cox-PH |
| Tan et al. (2020), Poirion et al. (2021), Zhang X. et al. (2021), Zheng et al. (2021), Zhao L. et al. (2021), Yin et al. (2022), Fan et al. (2023), Majji et al. (2023) | Pan-cancer | Survival neural network, CNN-Cox, Cox-PH, DeepOmix, lasso and group penalized Cox-PH, VAE based NN |
| Willems et al. (2023) | Colorectal cancer | Lasso Cox-PH |
| Moreno-Sanchez (2023) | Heart failure | Cox-PH, RSF |
| Wang J. et al. (2023) | HER2-negative metastatic breast cancer | Cox-PH |
| Baek and Lee (2020), Zhou et al. (2023) | Pancreatic cancer | Cox-PH, l2 regularized regression |
| Abdelhamid et al. (2022) | Trauma | RF, SVM for outcome prediction |
| Miao et al. (2022) | Nasophrngeal carcinoma | Cox-PH |
| Unterhuber et al. (2021), Vahabi et al. (2021), Xu et al. (2021), Zeng et al. (2021), Feng et al. (2022) | Cardiovascular disease | Survival outcome prediction based on naive Bayes, ANNs, and SVM, Logistic regression and XGboost. Survival prediction: Cox-PH, survival XGboost, DeepHit, DeepSurv, Cox-PH, Linear MTLR, and RSF |
| Richard et al. (2022) | COVID-19 | SVM |
| Wang et al. (2022) | Neuroblastoma | Deep neural network (DNN) |
| Lin et al. (2022) | Invasive ductal carcinoma | Multivariate Cox two way stepwise regression |
| Bichindaritz and Liu (2022) | Stomach, Esophageal carcinoma and Ovarian serous cystadenocarcinoma | Bidirectional LSTM, ordinal Cox model network and auxiliary loss |
| Wu et al. (2022) | Lower grade glioma | Lasso Cox-PH |
| Jiang et al. (2022) | Renal cell carcinoma | Cox-PH |
| Du et al. (2020), Lee et al. (2020), Kazerooni et al. (2021), Redekar et al. (2022), Wu and Fang (2022) | Glioblastoma | Cox-PH, CoxNet, SVM and Cox-PH, lasso Cox-PH |
| Hu Q. et al. (2021) | Cervical cancer | RSF, and Cox-PH |
| Tong et al. (2021) | Ovarian and breast cancer | |
| Kantidakis et al. (2020) | Liver transplantation | RSF, Cox-PH, and partial logistic artificial neural networks (PLANN) |
| Lv et al. (2020) | Lung adenocarcinoma | |
| Li et al. (2020) | Gastric cancer | Lasso, univariate and multi-variate Cox-PH |
| Jiang et al. (2020) | Lung cancer | Cox-nnet |
| Yu et al. (2020) | Esophageal squamous cell carcinoma | Support vector machine, K-means clustering |
| Yang Q. et al. (2020) | Glioma | Cox regression |
| Wang et al. (2020) | Liver cancer | XGBoost for subtype classification, and Cox-PH for survival prediction |
Furthermore, Supplementary Table S3 provides details about predictors distribution with respect to survival endpoints. A detailed analysis reveals, out of 90 predictors, 47, 8, 1, and 6 models have been utilized for OS, DFS, PFS, and BC survival endpoints, respectively. Unlike disease-specific predictors, here a mixture of methods is utilized and no particular trend exists. To provide high-level overview of multiple methods that have been utilized in all four survival endpoints we have provided a graphical representation of methods in Figure 8.
Figure 8.

Hierarchal illustration of survival prediction methods under three different categories.
It can be seen in Figure 8, diverse types of methods that have been utilized in survival predictive pipelines can be categorized into three different categories i.e., statistical, ML, and DL. Statistical methods are broadly classified into three different categories i.e., parametric, semi-parametric, and non-parametric models. Parametric methods make assumptions about the survival time distribution (Lee and Wang, 2003; Kubi et al., 2022). Parametric methods include exponential, Weibull, log-normal, Weibull, gamma models, and so on (Ishak et al., 2013; Kubi et al., 2022). Comparatively, semi-parametric methods make no assumptions about the shape of the baseline hazard function (non-parametric) (Kleinbaum and Klein, 1996). Rather, these methods assume a specific functional form for the effect of covariates (parametric) (Sinha and Dey, 1997). In comparison, non-parametric methods do not take into account assumptions about the underlying distribution of survival times and the shape of the hazard function. These methods include Kalpan-Meier, Nelson-Aalen, Breslow, Gehan-Eilcoxon, and life table methods (Stevenson and EpiCentre, 2009). Some statistical methods (i.e., COX-PH) have certain disadvantages with multiomics based survival prediction (Lee and Lim, 2019). For instance, COX-PH assumes linear relationships among variables and fails to capture complex and non-linear data patterns (Therneau et al., 2000). These methods perform poorly on high dimensional data where the number of features is larger than the number of samples. This specific gap is filled by the emergence of AI based models. Various ML models are utilized for survival analysis such as random survival forest (Ishwaran et al., 2008), and boosting-based methods (Binder and Schumacher, 2008). Shivaswamy et al. (2007), Van Belle et al. (2007), and Khan and Zubek (2008) proposed ranking and regression-based survival SVM for survival prediction while handling right censored data. Particularly, survival SVM is used in three ways for survival prediction i.e., ranking, regression, and combined. Ishwaran et al. (2008) proposed RSF where log-rank test is utilized for the splitting as compared to the Gini impurity of the classical random forest models.
DL methods are utilized in two ways to model survival prediction tasks i.e., continuous and discrete time (Kvamme et al., 2019). Models like CoxCC and time (Kvamme et al., 2019), piecewise constant hazard or PEANN (Fornili et al., 2014), and DeepSruv (Katzman et al., 2018) are utilized for continuous survival time prediction. Whereas, Nnet-survival (Gensheimer and Narasimhan, 2019), Nnet-survival probability mass function (PMF) (Kvamme and Borgan, 2019b), DeepHit and DeepHit Single (Lee et al., 2018), multi-task logistic regression (MTLR) (Yu et al., 2011; Fotso, 2018), and BCESurv (Kvamme and Borgan, 2019a) are utilized to predict survival in a discrete-time setting.
5.6 RQ IX: open source tools and libraries potential for development of survival prediction pipelines
Following the objective research question IX, this section summarizes details of open-source libraries and source codes of existing survival predictors. This comprehensive information will facilitate researchers to build upon existing work, fostering a collaborative environment and accelerating the development of robust and effective survival prediction models.
Table 9 presents an overview of open-source survival prediction models. Among the 90 distinct survival prediction studies, only 28 have provided publicly accessible source code. Among these studies, six studies have utilized R (Kantidakis et al., 2020; Li et al., 2021; Redekar et al., 2022; Zhang S. et al., 2022; Ellen et al., 2023; Willems et al., 2023) and 22 have opted for Python (Jiang et al., 2020; Tong L. et al., 2020; Chai et al., 2021a; Hathaway Q. A. et al., 2021; Hira et al., 2021; Malik et al., 2021; Poirion et al., 2021; Xu et al., 2021; Zhang X. et al., 2021; Zhao L. et al., 2021; Wang et al., 2022; Wu and Fang, 2022; Yin et al., 2022; Zhang J. Z. et al., 2022; Benkirane et al., 2023; Fan et al., 2023; Hao et al., 2023; Lang et al., 2023; Manganaro et al., 2023; Moreno-Sanchez, 2023; Palmal et al., 2023; Shetty et al., 2023). A comprehensive analysis of open source codes reveals that a majority of these tools have been developed from scratch without utilizing any specific survival prediction library (Benkirane et al., 2023; Hao et al., 2023; Manganaro et al., 2023; Shetty et al., 2023).
Table 9.
Summary of open-source survival prediction methods in existing studies.
| References | Disease | Approach | Source code |
|---|---|---|---|
| Shetty et al. (2023) | Kidney Papillary, Renal Cell Carcinoma (KIRP) | GeneNet | Link |
| Pellegrini (2023) | Localized prostate cancer | Coherent Voting Network (CVN) | Link |
| Hao et al. (2023) | GBM, KRCCC, LSCC, BIC | ANNs for binary survival class prediction | Link |
| Zhang S. et al. (2022) | Ovarian Cancer | DT, RF, and ANN | Link |
| Manganaro et al. (2023) | Non-small Cell Lung Cancer | Two layer SVM | Link |
| Benkirane et al. (2023) | Pan-cancer | ANN | Link |
| Fan et al. (2023) | Pan-cancer | Survival neural network | Link |
| Willems et al. (2023) | Colorectal cancer | Lasso penalized cox model | Link |
| Moreno-Sanchez (2023) | Heart failure | Two-way survival prediction | Link |
| Ellen et al. (2023) | Non-small cell lung cancer | Elastic net and cox proportional hazard model | Link |
| Yin et al. (2022) | Pan-cancer | CNN and a cox model (CNN-Cox) | Link |
| Wang et al. (2022) | Neuroblastoma | Deep neural network (DNN) | Link |
| Zhang J. Z. et al. (2022) | Breast cancer | Loghazard Net | Link |
| Wu and Fang (2022) | Glioblastoma, ovary and breast cancers | CoxNet | Link |
| Redekar et al. (2022) | Glioblastoma multiforme | Cox regression | Link |
| Hathaway Q. A. et al. (2021) | Atherosclerosis | Various models | Link |
| Xu et al. (2021) | Cardiovascular disease | DeepSur, Cox-PH, RSF | Link |
| Poirion et al. (2021) | Pan-cancer | Cox-PH model | Link |
| Zhao L. et al. (2021) | 8 cancer subtypes | DeepOmix based on DNN | Link |
| Chai et al. (2021a) | Bladder cancer | Cox regression, deep cox neural network | Link |
| Hira et al. (2021) | Ovarian cancer | Cox-PH regression | Link |
| Tong et al. (2021) | Ovarian, lung, kidney, and pancreatic cancer | Various survival models | Link |
| Kantidakis et al. (2020) | Liver transplantation | RSF, Cox-PH, PLANN | Link |
| Jiang et al. (2020) | Lung adenocarcinoma | Cox-nnet | Link |
| Tong L. et al. (2020) | Breast cancer | DNN and cox proportional hazard model | Link |
| Li et al. (2021) | Prostate cancer | BLUP | Link |
| Malik et al. (2021) | Breast cancer | Deep neural network | Link |
| Zhang X. et al. (2021) | Pan-cancer | Deep Neural network | Link |
| Kim (2023) | – | Graph Neural networks | – |
Approximately 10 different survival prediction packages or libraries have been developed as shown in Table 10. Each library offers a diverse set of preimplemented statistical, ML, and DL survival prediction models. For instance, Pycox (Kvamme et al., 2019) primarily focuses on continuous and discrete DL survival prediction models such as CoxTime, CoxCC, MTLR, and so on. Lifelines (Davidson-Pilon, 2019), scikit-survival (Pölsterl, 2020), and pysurvival (Fotso et al., 2019 ) cover a wide range of statistical and ML survival prediction models like Cox-PH, RSF, survival support vector machine, and gradient boosting survival (Davidson-Pilon, 2019; Fotso et al., 2019; Pölsterl, 2020).
Table 10.
Survival analysis libraries, models, and evaluation metrics.
| Library | Language | Models | Evaluation metrics |
|---|---|---|---|
| Scikit-survival (Pölsterl, 2020) | Python | Cox-PH, Penalized Cox-PH, RSF, Kaplan-Meier, Gradient boosting survival, Survival suppport vector machine | Concordance Index (C-index), Integrated Brier Score |
| Lifelines (Davidson-Pilon, 2019) | Python | Kaplan-MeierFitter, CoxTimeVaryingFitter, Survival regression, Discrete survival models, Piecewise exponential models | Concordance Index (C-index) |
| Survival (Therneau and Lumley, 2015) | R | Survival regression, Cox-PH, accelerated time failure (AFT) models, Competing risk analysis, | Hazard Ratios, Log-likelihood, Akaike Information Criterion (AIC) |
| Statsmodels (McKinney et al., 2011) | Python | PHReg, AFT models | Hazard Ratios, Log-likelihood, Akaike Information Criterion (AIC) |
| Pycox (Kvamme et al., 2019) | Python | Continuous time models such as Cox-Time, CoxCC, PCHazard and DeepSurv, Discrete time models such as Nnet-survival, probability mass function, DeepHit, multitask logistic regression, and BCEsurv | Concordance Index, integrated and administrative Brier Score, time dependent concordance index, negative and integrated bionomial log likelihood |
| Pysurvival (Fotso et al., 2019 ) | Python | CoxPH, RSF, Kaplan-Meier, Survival Support Vector Machine, multitask logistic regression, Parametric models like exponential, Weibull, Gompertz, log logistic, and log normal | Concordance Index (C-index), Integrated Brier Score |
| flexsurv (Jackson, 2016) | R | Parametric survival models (e.g., Weibull, Exponential) | Hazard Ratios, Log-likelihood, Akaike Information Criterion (AIC) |
| mlr3proba (Sonabend et al., 2021) | R | Density estimation measures, Cox-PH, flexible spline models, penalized regression, RSF, Van Belle support vector machine, gradient boostinf machine DeepSurv, DeepHit, CoxTime | Houwelingen's β, C-index, time dependent AUC, log-loss, integrated log loss, Brier and integrated Brier score, and Schmid score |
| rstpm2 (Clements, 2019) | R | Restricted Mean Survival Time (RMST), Cause-specific Hazard Models, Fine-Gray Model (Competing Risks) | IBS, Time-dependent ROC curves, Grays Test for Equality of Cumulative Incidence Functions |
| Survex (Spytek et al., 2023) | R | Local and global explanations for survival prediction models | None |
| SurvSHAP (Krzyziński et al., 2023) | Python | Shapely additive explanations for survival prediction models | – |
Notably, addressing the lack of interpretability or explainability in the previously discussed libraries, Spytek et al. (2023) introduced Survex. This library allows researchers to analyze the features responsible for a specific event by offering different methods for both local and global explanations of various survival prediction models.
The selection of a specific library is inherently subjective and depends on factors such as the preferred development platform, choice of survival prediction models, and the specific research question in hand. Therefore, recommendations are made based on the number of survival prediction models and evaluation measures each library offers. For Python, Lifelines (Davidson-Pilon, 2019) and Pycox (Kvamme et al., 2019) are recommended, with Lifelines (Davidson-Pilon, 2019) providing a diverse range of statistical and ML models, while Pycox (Kvamme et al., 2019) is specialized in DL models. Additionally, for R, mlr3proba (Sonabend et al., 2021) is recommended, as it offers a variety of statistical and ML models for survival prediction. Ultimately, selecting a library aligned with individual research needs not only streamlines the development process but also contributes to the overall reliability of survival prediction models.
5.7 RQ X: strategies for assessing survival predictors: unveiling common evaluation measures
The main objective of this section is to provide a concise overview of research question X, which focuses on the commonly employed evaluation measures for survival predictive pipelines.
Table 11 shows a compilation of 18 distinct evaluation measures that have been commonly used to evaluate survival prediction pipelines. The survival prediction pipelines can be categorized into two distinct classes namely survival outcome prediction (Lynch et al., 2017) and survival prediction (Tarkhan et al., 2021). Details related to these categories is provided in the background section. Out of 18 evaluation measures mentioned in Table 11, a set of 10 evaluation measures have been employed to assess the performance of survival outcome prediction models. In addition to the aforementioned measures, 8 other evaluation measures have been utilized to assess the performance of survival prediction models.
Table 11.
A summary of evaluation measures used in survival prediction and survival outcome prediction pipelines.
| Task | Evaluation measure | Count | References | Advantages |
|---|---|---|---|---|
| C-index | 43 | Pellegrini, 2023; Qian et al., 2023; Shetty et al., 2023 | Robust, measures discriminatory power. Less sensitive to censoring compared to other metrics. | |
| BS | 7 | Kantidakis et al., 2020; Hathaway Q. A. et al., 2021; Xu et al., 2021 | Measures accuracy of predicted survival probabilities. | |
| IBS | 5 | Xu et al., 2021; Jung et al., 2023; Othman et al., 2023 | Considers entire survival time distribution. | |
| Survival prediction | Log Rank P-value | 9 | Jiang et al., 2022; Redekar et al., 2022; Benkirane et al., 2023; Zhang et al., 2023 | Tests differences in survival experiences. |
| DCA | 1 | Miao et al., 2022 | Accounts for clinical consequences. | |
| Kappa | 3 | Zheng et al., 2021; Pellegrini, 2023; Shetty et al., 2023 | Measures agreement beyond chance. | |
| TD-ROC | 2 | Wang J. et al., 2023; Zhang et al., 2023 | Time-dependent evaluation of ROC. | |
| AUC-pval | 1 | Pellegrini, 2023 | Evaluates AUC significance. | |
| Odds ratio | 1 | Pellegrini, 2023 | Measures association between groups. | |
| Likelihood Ratio | 1 | Tong D. et al., 2020 | Helps in understanding the odds of a predicted event occurring compared to the odds of it not occurring. | |
| AUC-ROC | 21 | Hao et al., 2023; Pellegrini, 2023; Qian et al., 2023 | Provides a comprehensive view of the model's performance across various threshold values. | |
| Accuracy | 12 | Hao et al., 2023; Lee et al., 2023 | Simple and easy to understand, providing an overall measure of correct predictions. | |
| Precision | 6 | Chauhan et al., 2023; Hao et al., 2023; Othman et al., 2023; Wang J. et al., 2023 | Useful when the cost of false positives is high, as it focuses on the accuracy of positive predictions. | |
| Recall | 6 | Chauhan et al., 2023; Hao et al., 2023; Othman et al., 2023; Wang J. et al., 2023 | Emphasizes the ability of the model to capture all positive instances, important for sensitive scenarios. | |
| Survival outcome prediction | MCC | 1 | Othman et al., 2023 | |
| F1-Score | 2 | Zeng et al., 2021; Wang et al., 2022 | Harmonizes precision and recall, making it useful when there is a trade-off between false positives and false negatives. | |
| PPV | 1 | Zeng et al., 2021; Chauhan et al., 2023 | Focuses on the proportion of true positives among positive predictions, providing insights into prediction accuracy. | |
| NPV | 1 | Zeng et al., 2021; Chauhan et al., 2023 | Focuses on the proportion of true negatives among negative predictions, providing insights into prediction accuracy. |
In survival prediction category based evaluation measures, the objective is to capture two distinct characteristics namely, calibration and discrimination (D'Agostino and Nam, 2003; Simino, 2009). Specifically, calibration refers to how well the predicted probabilities of survival align with the actual observed survival rates over time (D'Agostino and Nam, 2003). Under this paradigm most widely used evaluation measures are BS (Schumacher et al., 2003), IBS (Gerds and Schumacher, 2006), TD-ROC (Heagerty et al., 2000), and DCA (Vickers and Elkin, 2006). Discrimination paradigm based evaluation measures capture differentiation between individuals with different survival times. Under this paradigm most widely used measures are C-index (Hartman et al., 2023), AUC-ROC (Terrematte et al., 2022), and likelihood ratio (Murphy, 1995).
On the other hand objective of survival outcome prediction evaluation measures is to assess diverse characteristics of a model i.e., efficacy of the model, overall accurate predictions, biasness toward type I or type II errors (Hao et al., 2023; Lee et al., 2023). Specifically, accuracy and F1 score are used to measure overall accurate predictions, precision, and recall examine the model's biasness with respect to type I and type II errors (Zeng et al., 2021; Wang et al., 2022). Additionally, MCC provides a comprehensive assessment, taking into account overall accurate predictions, and errors (Othman et al., 2023). In addition, AUC-ROC assesses the predictive potential of a model by analyzing the true positive rate (TPR) and true negative rate (TNR) at different thresholds (Hao et al., 2023; Pellegrini, 2023; Qian et al., 2023).
5.8 RQ XI: publisher and journal-wise distribution of research papers
This section addresses research question XI by presenting the distribution of survival prediction literature across diverse journals and publishers. Overall, this analysis not only enables researchers to strategically position their work but also offers opportunities for interdisciplinary collaboration, promoting a more interconnected and dynamic research landscape within the domain of survival prediction.
In Figures 9, 10, the distribution of survival prediction literature is presented based on journals and publishers. The studies have been published in 25 different publishers, including but not limited to Springer, Elsevier, Oxford Press, and BioMed Central. Notably, around 30 out of 90 survival prediction studies have been disseminated through Springer, and BioMed Central. Furthermore, Elsevier has contributed to the field by publishing 10 relevant papers in recent years. Particularly, these studies have been published in more than 50 different conferences/journals, which shows the diversity of the survival prediction landscape.
Figure 9.

Journal-wise distribution of articles.
Figure 10.

Publisher-wise distribution of articles.
6 Discussion
The field of disease survival prediction has become a pivotal aspect of effective healthcare, especially within the domain of precision medicine. Recognizing the significant variability present among patients within specific diseases, there is an increasing demand and development for disease specific survival predictors. Our analysis reveals that researchers place a profound emphasis on predicting survival in cancer as compared to other diseases, and there are compelling reasons behind this focus. First, cancer exhibits significant variability from one patient to another as compared to other diseases, which highlights the imperative need for cancer survival prediction to explore and comprehend the heterogeneity of cancer. Second, cancer is a leading cause of death worldwide, and effective survival prediction can aid in early detection and intervention, potentially saving lives. Third, a huge amount of data sources are developed to make cancer-related data publicly available to accelerate and optimize cancer-related research.
Furthermore, to analyze the trajectory of the disease, researchers place great focus on studying different survival endpoints that suit the respective research setting i.e., treatment, progression, recurrence, and death. Among four different survival endpoints i.e., OS, DFS, BC, and PFS, OS is often emphasized more in survival prediction studies. Despite the prime focus on OS, the significance of other survival endpoints in understanding disease trajectories cannot be understated. These survival endpoints help to analyze different characteristics of diseases such as understanding treatment efficacy and durability, treatments that not only extend life but also effectively manage the course of the illness, and markers responsible for disease recurrence. The lack of research in other survival endpoints opens up new research avenues for the AI experts to develop novel methods that can help explore various characteristics related to disease.
Although both public and private databases have been utilized in survival prediction studies, yet the preference for public databases stems from their accessibility and the wealth of information they provide. For instance, TCGA (Tomczak et al., 2015) offers a vast array of genomic and clinical data across different cancer types. This invaluable resource aids researchers in developing accurate survival prediction models. Likewise, GDC (Jensen et al., 2017) and GEO (Clough and Barrett, 2016) offer comprehensive datasets that encompass a wide range of diseases, making them appealing choices for various research endeavors. Furthermore, a crucial observation regarding private data sources is that they are not universally accessible. This argument is supported by the limited accessibility of omics datasets related to cardiovascular diseases. Despite a singular study employing omics data for survival prediction in cardiovascular diseases, the challenge lies in the difficulty of retrieving the original data. Authors often refrain from sharing their datasets, and obtaining access to databases requires extensive proposals, adding a layer of complexity to the development of novel survival prediction pipelines for cardiovascular diseases. This obstacle may impede the advancement of innovative survival prediction pipelines for cardiovascular disease.
Overall, the use of omics and clinical data in survival prediction tools marks a significant stride toward precision medicine. The distribution of omics types in survival prediction studies reveals a preference for mRNA, methylation, microRNA, and CNV across various cancer subtypes. In addition, the limited number of multiomics based survival prediction studies in cardiovascular diseases hinders definitive conclusions on the importance of specific omics types. Disease-specific patterns highlight the importance of tailored clinical markers, prominently seen in cancer studies with a focus on tumor stage and histological type. Treatment-related features, notably chemotherapy and radiotherapy, underscore the impact of therapeutic interventions on survival predictions. Moreover, clinical features along with omics data with diverse molecular aspects are utilized together to improve the performance of survival prediction models. Diverse survival prediction research accentuates the pivotal role of leveraging patient information, such as medical history, demographics, disease-related features, and diagnostic records. This trend reflects an increasing recognition of the potential of clinical data in not only understanding disease progression but also in guiding personalized treatment strategies and enhancing patient care. A recent benchmark study on survival prediction models with multiomics and clinical data also shows the significant role of clinical data in survival prediction across multiple cancer subtypes (Herrmann et al., 2021).
In addition, our analysis reveals that increasing the total number of data modalities does not necessarily offer improved survival predictions, yet data modalities are quite specific to the disease and survival endpoints. Therefore, the selection of data modalities should be made very carefully as rather than improving the overall performance it can induce undesirable noise in the analysis.
One of the common problems in survival analysis is data censoring (Leung et al., 1997). Censoring arises when there is incomplete information about the time points and/or events of some subjects in a study. There are different types of censoring i.e., (I) Right Censoring is the most common type of data censoring, where an event does not occur for some subjects by the end of study or by the last time point at which data is collected. For example, a subject withdraws from the study or there is a lost follow up for a specific subject (II) Left Censoring is the least common type of censoring where the event may occur before the start of the study or during the data collection phase. (III) Interval Censoring arises when the event of interest occurs in a time interval but the exact time point is not known. In survival analysis, three assumptions are taken into account to infer censored data i.e., (I) Independent Censoring: assumes that the censoring times for multiple subjects are independent of each other. (II) Random censoring assumes that the time t at which individuals are censored must be random and the failure rate for subjects who are censored is assumed to be equal to the failure rate for subjects who remained in the risk set who are not censored. (III) Non-informative censoring occurs if the distribution of survival times (T) provides no information about the distribution of censorship times (C), and vice versa. Although, data censoring is quite important in terms of survival prediction, yet it has been discussed and dealt with properly in the existing studies. We recommend to incorporate comprehensive details of data censoring in future survival prediction studies. Particularly details on how each type of data censoring is handled should not be neglected.
Our analysis of the utilization of feature engineering methods raises two crucial points. First, even though a plethora of methods have been already tested for various survival prediction studies, autoencoder based methods tend to reduce the dimensionality of omics data modalities more efficiently. In addition, the rest of the methods work much better with clinical features. The success of feature engineering approaches is contingent upon the chosen technique with the inherent properties of the data. This highlights the importance of large-scale benchmark studies in guiding the selection of feature engineering strategies for the development of accurate predictive pipelines.
In end-to-end survival predictive pipelines, researchers have utilized methods from three different families namely statistical (Hazard models, Kaplan-Meier Estimator, Log-Rank Test, and Frailty Models) (Kleinbaum and Klein, 1996), ML (Random Forests, Support Vector Machines, Gradient Boosting Machines, and Nearest Neighbors) (Ishwaran et al., 2008; Ma et al., 2022), and DL (CoxNnet, DeepSurv) (Ching et al., 2018; Katzman et al., 2018). Statistical methods are unable to extract complex non-linear patterns that is why in current predictors focus of researchers is on ML or DL based methods (Katzman et al., 2018). In spite of the applications and usefulness of traditional ML methods, they face numerous limitations when applied to survival prediction. These limitations arise either from the inherent challenges of survival data or from the models themselves. Such limitations include censored observations (Khan and Zubek, 2008), overfitting and outliers (Biccler et al., 2020; Nariya et al., 2023), and complex relationships among variables. ML models also suffer from outliers in survival prediction datasets (Biccler et al., 2020). DL methods address many of these limitations through their advanced architectures and ability to learn complex patterns from large datasets. DL models such as DeepSurv, extend the Cox proportional hazards model by learning non-linear representations of the covariates and handling censored data effectively (Katzman et al., 2018). This model leverages the strengths of neural networks to capture complex relationships and interactions between variables, improving prediction accuracy (Katzman et al., 2018). In addition, there are some advantages of ML methods as well, i.e., they perform better even on small datasets while DL methods require large data (LeCun et al., 2015). Similarly, ML methods decisions are explainable and DL methods decisions are black box (Dwivedi et al., 2023). Although, a research comunity is focusing on unveiling black box decisions of predictors. However, in survival prediction, most of predictors do not have explainability component (Krzyziński et al., 2023). But researchers are trying to incorporate explainability methods with survival models (Krzyziński et al., 2023).
While developing different data modalities based on survival predictor, predictive pipelines require dimensionality reduction methods that avoid the curse of the dimensionality problem (Feldner-Busztin et al., 2023). Although several traditional methods (PCA, LDA, TSNE, UMAP etc.) have been developed to transform data into new space that have more comprehensive patterns and less number of features. However, these methods lacks in extracting and incorporating non-linear patterns of features (Gastinel, 2012; Kirpich et al., 2018; Degenhardt et al., 2019). On the other hand in deep learning based predictive pipelines, researchers are utilizing auto-encoders that are capable of generating more comprehensive feature space by extracting both linear and non-linear patterns of features (Tan et al., 2020). Following overall pros and cons of ML and DL based predictive pipelines, new predictors can be developed by utilizing ML based methods with smaller datasets. Moreover, in these predictors rather than utilizing traditional dimensionality reduction methods, autoencoders can be utilized. Moreover, when data is large, it is better to develop DL predictors but these predictors must be enriched with explainability methods.
With an aim to evaluate the performance of predictive pipelines, diverse types of evaluation measures have been developed. Each evaluation measure addresses a specific aspect of survival prediction models, precluding the possibility of any single metric being universally ideal for a comprehensive evaluation of survival prediction. For instance, C-index estimates the robustness and discriminatory power of the survival prediction model. In addition, BS and IBS measure the accuracy of a model on time distribution. Moreover, log-rank p-value evaluates the potential of the model by testing the differences in different survival groups. Although these measures are the most commonly utilized, there are diverse other evaluation measures for similar purposes i.e., restricted mean survival time (RMST), odds ratio (Pellegrini, 2023), Kappa for inter-rater reliability (Zheng et al., 2021), integrated absolute error (IAE), integrated square error (ISE), mean absolute error (MAE), integrated AUC (IAUC) time-dependent integrated discrimination improvement, and time-dependent net reclassification improvement (NRI). Furthermore, while these individual measures provide valuable insights, it is noteworthy to mention that their collective application offers a more comprehensive evaluation. Therefore, we recommend utilizing multiple evaluation measures to assess discrimination and calibration of survival prediction models.
7 Reccomendations
With an aim to expedite and enhance research in survival prediction. Hereby, on the basis of Table 12, we summarize some important recommendations for future survival prediction studies.
Table 12.
A summary of key research questions of our review and main findings.
| Research question (RQ) | Main findings |
|---|---|
| RQ I, II, III: Survival predictors distribution analysis across diseases and survival endpoints | A detailed analysis of the past three years shows that survival prediction models have been developed majorly for 36 distinct cancer subtypes, as outlined in Table 3. Additionally, the primary focus of this research has been on overall survival (OS) as the clinical/survival endpoint. |
| RQ IV: Survival prediction data availability in public and private sources and opportunities for the development of predictors | Publicly accessible data primarily comes from three key databases: the Cancer Genome Atlas Program (TCGA), NCI Genomic Data Commons (GDC), and the Gene Expression Omnibus (GEO). In contrast, private databases also exist but present several challenges. Limited accessibility to private data hinders the reproducibility and validation of survival models, and the lack of standardized access complicates model comparison, potentially introducing bias and impacting generalizability. In addition, our recommendation is to use Survboard datasets for benchmarking and testing of survival models, which are available at https://survboard.vercel.app/. |
| RQ V, VI: Survival prediction data modalities and utilization of their combinations for disease and survival endpoints specific predictors development | The selection of data modalities depends on the disease and survival endpoint. For example, in cancer subtypes, mRNA, miRNA, and methylation data are most frequently used. Similarly, these modalities are commonly employed for OS endpoint, while distinct patterns are less evident for DFS, PFS, and BC endpoints. In addition, clinical features such as demographic, histological, lifestyle, and comorbidity are of high importance and are used commonly in survival analysis. |
| RQ VII: Feature engineering trends across data modalities and disease-specific survival predictors | In terms of cardiovascular diseases, univariate analyses, and supervised feature engineering methods i.e., Cox regression, L1 regularized Cox regression, and RSF algorithm, are common, while cancer research based on multiomics data opts for dimensionality reduction methods like PCA, AEs, and VAEs. There is no consistent or apparent effect of survival endpoints on the selection of feature engineering method in the published literature. |
| RQ VIII: Survival Prediction Methods Insights and Distribution Across Disease Types and Survival Endpoints | A plethora of statistical, machine ML, and DL based approaches have been utilized for survival prediction. However, our analysis reveals that statistical methods have significant disadvantages: they depend on strong assumptions like the proportionality of hazards, struggle with high-dimensional data, and complex non-linear relationships. Additionally, they are sensitive to outliers and missing data. In contrast, DL methods such as DeepSurv, Survival Convolutional Neural Networks (SurvCNN), BCESurv, SurNnet, and autoencoders are preferred due to their ability to handle high-dimensional data, model non-linear relationships, and integrate heterogeneous data sources, making them more robust and accurate for multiomics based survival prediction. |
| RQ IX: Open source tools and libraries potential for development of survival prediction pipelines | For survival analysis in Python, Lifelines and Pycox are commonly used packages. Lifelines provides a diverse range of statistical and ML models, while Pycox specializes in DL models. Alternatively, mlr3proba is also used which can be a good choice for R users, offering a variety of statistical and ML models for survival prediction. |
| RQ X: Strategies for assessing survival predictors: unveiling common evaluation measures | In our findings on survival prediction evaluation, we discovered two key assessment paradigms: calibration and discrimination. Calibration evaluates the alignment between predicted and observed survival rates over time using measures like BS, IBS, TD-ROC, and DCA. Meanwhile, discrimination measures such as C-index, AUC-ROC, and likelihood ratio focus on distinguishing individuals with varying survival times. Additionally, for overall model evaluation, we identified accuracy, F1 score, precision, recall, MCC, and AUC-ROC as crucial metrics for assessing efficacy, prediction accuracy, and bias toward type I or type II errors. |
| RQ XI: Publisher and journal-wise distribution of research papers | Our analysis of the survival prediction literature reveals a diverse distribution across various publishers. Among the 16 publishers identified, notable contributions come from Springer, Elsevier, Oxford Press, and BioMed Central. Around 30 out of 74 studies have been disseminated through Springer and BioMed Central, highlighting their significant presence in the field. Additionally, Elsevier has contributed 10 relevant papers in recent years. These studies have been published across more than 50 different conferences and journals, underscoring the breadth and diversity of the survival prediction landscape. |
We highly recommend leveraging open-source tools and libraries for developing survival prediction pipelines. Pycox (Kvamme et al., 2019), Lifelines (Davidson-Pilon, 2019), and scikit-survival (Pölsterl, 2020) are excellent choices, offering a rich array of pre-implemented statistical, ML, and DL models. In addition, selecting appropriate evaluation measures is paramount. We advise researchers to carefully choose measures aligned with their research question and survival prediction task. Utilizing multiple measures ensures a comprehensive assessment of model performance i.e., C-index, IBS, BS, and ROC (Schumacher et al., 2003; Gerds and Schumacher, 2006; Terrematte et al., 2022; Hartman et al., 2023).
Integration of clinical and omics data is key to improving prediction accuracy. Researchers should explore diverse data sources and consider disease-specific patterns and survival endpoints to enhance the predictive power of their models. Researchers should carefully use feature engineering methods tailored to their data characteristics. Autoencoder-based dimensionality reduction for omics data and traditional methods for clinical features can significantly enhance predictive pipelines. Particularly it is important to note that addressing data censoring transparently is essential for model reliability. We recommend providing comprehensive details on censoring types and handling methods to ensure the robustness of survival prediction models.
Both traditional ML and DL methods offer unique advantages. Researchers should explore the strengths of each approach, with a particular focus on DL methods like DeepSurv for capturing complex relationships. In addition, models like Transformers can also be used to deal with clinical data which shall be an interesting research perspective in future (Pant et al., 2023). Enriching survival prediction models with explainability methods is crucial for improving interpretability. By understanding and unveiling model decisions, researchers can enhance trust and adoption in clinical settings. By following such recommendations, researchers can contribute to the development of robust and effective survival prediction models, ultimately facilitating personalized treatment strategies and improving patient care across various disease.
Data availability statement
The original contributions presented in the study are included in the article/Supplementary material, further inquiries can be directed to the corresponding author.
Author contributions
AA: Conceptualization, Data curation, Formal analysis, Investigation, Methodology, Software, Validation, Visualization, Writing – original draft, Writing – review & editing. MA: Conceptualization, Data curation, Investigation, Methodology, Software, Supervision, Validation, Writing – original draft, Writing – review & editing. SA: Supervision, Writing – review & editing. SV: Supervision, Visualization, Writing – original draft, Writing – review & editing. AD: Supervision, Writing – review & editing.
Funding Statement
The author(s) declare that financial support was received for the research, authorship, and/or publication of this article. The project EVENTFUL on which report is based was funded by Federal Ministry of Education and Research under grant number 01|W23005. The responsibility for the content of this publication lies with the authors.
Conflict of interest
The authors declare that the research was conducted in the absence of any commercial or financial relationships that could be construed as a potential conflict of interest.
Publisher's note
All claims expressed in this article are solely those of the authors and do not necessarily represent those of their affiliated organizations, or those of the publisher, the editors and the reviewers. Any product that may be evaluated in this article, or claim that may be made by its manufacturer, is not guaranteed or endorsed by the publisher.
Supplementary material
The Supplementary Material for this article can be found online at: https://www.frontiersin.org/articles/10.3389/frai.2024.1428501/full#supplementary-material
References
- Abdelhamid S., Scioscia J., Li S., Das J., Rahman S., Bonaroti J. W., et al. (2022). Multi-omic admission-based biomarkers predict 30-day survival and persistent critical illness in trauma patients after injury. J. Am. Coll. Surg. 235:S95. 10.1097/01.XCS.0000896540.67938.36 [DOI] [PMC free article] [PubMed] [Google Scholar]
- Ahmed F. E. (2005). Artificial neural networks for diagnosis and survival prediction in colon cancer. Mol. Cancer 4, 1–12. 10.1186/1476-4598-4-29 [DOI] [PMC free article] [PubMed] [Google Scholar]
- Al-Lazikani B., Banerji U., Workman P. (2012). Combinatorial drug therapy for cancer in the post-genomic era. Nat. Biotechnol. 30, 679–692. 10.1038/nbt.2284 [DOI] [PubMed] [Google Scholar]
- Altuhaifa F. A., Win K. T., Su G. (2023). Predicting lung cancer survival based on clinical data using machine learning: a review. Comp. Biol. Med. 165:107338. 10.1016/j.compbiomed.2023.107338 [DOI] [PubMed] [Google Scholar]
- Amgalan B., Lee H. (2015). Deod: uncovering dominant effects of cancer-driver genes based on a partial covariance selection method. Bioinformatics 31, 2452–2460. 10.1093/bioinformatics/btv175 [DOI] [PubMed] [Google Scholar]
- Arjmand B., Hamidpour S. K., Tayanloo-Beik A., Goodarzi P., Aghayan H. R., Adibi H., et al. (2022). Machine learning: a new prospect in multi-omics data analysis of cancer. Front. Genet. 13:824451. 10.3389/fgene.2022.824451 [DOI] [PMC free article] [PubMed] [Google Scholar]
- Ashley E. A. (2016). Towards precision medicine. Nat. Rev. Genet. 17, 507–522. 10.1038/nrg.2016.86 [DOI] [PubMed] [Google Scholar]
- Azizi F., Ghasemi R., Ardalan M. (2022). Two common mistakes in applying anova test: guide for biological researchers. Preprint. 10.20944/preprints202207.0082.v1 [DOI] [Google Scholar]
- Baek B., Lee H. (2020). Prediction of survival and recurrence in patients with pancreatic cancer by integrating multi-omics data. Sci. Rep. 10:18951. 10.1038/s41598-020-76025-1 [DOI] [PMC free article] [PubMed] [Google Scholar]
- Bakasa W., Viriri S. (2021). Pancreatic cancer survival prediction: a survey of the state-of-the-art. Comput. Math. Methods Med. 2021:1188414. 10.1155/2021/1188414 [DOI] [PMC free article] [PubMed] [Google Scholar]
- Bashiri A., Ghazisaeedi M., Safdari R., Shahmoradi L., Ehtesham H. (2017). Improving the prediction of survival in cancer patients by using machine learning techniques: experience of gene expression data: a narrative review. Iran. J. Public Health 46:165. [PMC free article] [PubMed] [Google Scholar]
- Benkirane H., Pradat Y., Michiels S., Cournède P.-H. (2023). Customics: a versatile deep-learning based strategy for multi-omics integration. PLoS Comput. Biol. 19:e1010921. 10.1371/journal.pcbi.1010921 [DOI] [PMC free article] [PubMed] [Google Scholar]
- Bhat A. R., Hashmy R. (2023). Hierarchical autoencoder-based multi-omics subtyping and prognosis prediction framework for lung adenocarcinoma. Int. J. Inf. Technol. 15, 1–9. 10.1007/s41870-023-01310-x36721525 [DOI] [Google Scholar]
- Biccler J. L., Bøgsted M., Van Aelst S., Verdonck T. (2020). Outlier robust modeling of survival curves in the presence of potentially time-varying coefficients. Stat. Methods Med. Res. 29, 2683–2696. 10.1177/0962280220910193 [DOI] [PubMed] [Google Scholar]
- Bichindaritz I., Liu G. (2022). “Adaptive multi-omics survival analysis in cancer,” in Innovation in Medicine and Healthcare: Proceedings of 10th KES-InMed 2022 (Singapore: Springer; ), 51–62. Available online at: https://link.springer.com/book/10.1007/978-981-19-3440-7 [Google Scholar]
- Bild D. E., Bluemke D. A., Burke G. L., Detrano R., Diez Roux A. V., Folsom A. R., et al. (2002). Multi-ethnic study of atherosclerosis: objectives and design. Am. J. Epidemiol. 156, 871–881. 10.1093/aje/kwf113 [DOI] [PubMed] [Google Scholar]
- Billheimer D., Gerner E. W., McLaren C. E., LaFleur B. (2014). Combined benefit of prediction and treatment: a criterion for evaluating clinical prediction models. Cancer Inf. 13:CIN-S13780. 10.4137/CIN.S13780 [DOI] [PMC free article] [PubMed] [Google Scholar]
- Binder H., Schumacher M. (2008). Allowing for mandatory covariates in boosting estimation of sparse high-dimensional survival models. BMC Bioinform. 9, 1–10. 10.1186/1471-2105-9-14 [DOI] [PMC free article] [PubMed] [Google Scholar]
- Boffa D. J., Churchwell K. B., Maduka R. C. (2021). Diversity, equity, and representativeness: coming to terms with the henrietta lacks act. J. Natl. Comp. Cancer Netw. 19, 993–996. 10.6004/jnccn.2021.7071 [DOI] [PubMed] [Google Scholar]
- Bolstad B. M., Irizarry R. A., Åstrand M., Speed T. P. (2003). A comparison of normalization methods for high density oligonucleotide array data based on variance and bias. Bioinformatics 19, 185–193. 10.1093/bioinformatics/19.2.185 [DOI] [PubMed] [Google Scholar]
- Boorjian S. A., Thompson R. H., Tollefson M. K., Rangel L. J., Bergstralh E. J., Blute M. L., et al. (2011). Long-term risk of clinical progression after biochemical recurrence following radical prostatectomy: the impact of time from surgery to recurrence. Eur. Urol. 59, 893–899. 10.1016/j.eururo.2011.02.026 [DOI] [PubMed] [Google Scholar]
- Boshier P. R., Swaray A., Vadhwana B., O'Sullivan A., Low D. E., Hanna G. B., et al. (2022). Systematic review and validation of clinical models predicting survival after oesophagectomy for adenocarcinoma. Br. J. Surg. 109, 418–425. 10.1093/bjs/znac044 [DOI] [PMC free article] [PubMed] [Google Scholar]
- Bycroft C., Freeman C., Petkova D., Band G., Elliott L. T., Sharp K., et al. (2018). The UK biobank resource with deep phenotyping and genomic data. Nature 562, 203–209. 10.1038/s41586-018-0579-z [DOI] [PMC free article] [PubMed] [Google Scholar]
- Carobbio A., Guglielmelli P., Rumi E., Cavalloni C., De Stefano V., Betti S., et al. (2020). A multistate model of survival prediction and event monitoring in prefibrotic myelofibrosis. Blood Cancer J. 10:100. 10.1038/s41408-020-00368-1 [DOI] [PMC free article] [PubMed] [Google Scholar]
- Chai H., Zhang Z., Wang Y., Yang Y. (2021a). Predicting bladder cancer prognosis by integrating multi-omics data through a transfer learning-based cox proportional hazards network. CCF Transact. High Perform. Comp. 3, 311–319. 10.1007/s42514-021-00074-9 [DOI] [Google Scholar]
- Chai H., Zhou X., Zhang Z., Rao J., Zhao H., Yang Y. (2021b). Integrating multi-omics data through deep learning for accurate cancer prognosis prediction. Comput. Biol. Med. 134:104481. 10.1016/j.compbiomed.2021.104481 [DOI] [PubMed] [Google Scholar]
- Chauhan P. S., Shiang A., Alahi I., Sundby R. T., Feng W., Gungoren B., et al. (2023). Urine cell-free dna multi-omics to detect MRD and predict survival in bladder cancer patients. npj Precis. Oncol. 7:6. 10.1038/s41698-022-00345-w [DOI] [PMC free article] [PubMed] [Google Scholar]
- Chen Y.-C., Lee U. J., Tsai C.-A., Chen J. J. (2018). Development of predictive signatures for treatment selection in precision medicine with survival outcomes. Pharm. Stat. 17, 105–116. 10.1002/pst.1842 [DOI] [PubMed] [Google Scholar]
- Ching T., Zhu X., Garmire L. X. (2018). Cox-nnet: an artificial neural network method for prognosis prediction of high-throughput omics data. PLoS Comput. Biol. 14:e1006076. 10.1371/journal.pcbi.1006076 [DOI] [PMC free article] [PubMed] [Google Scholar]
- Clements M. (2019). Introduction to the rstpm2 package. Karolinska Institutet. [Google Scholar]
- Cleves M. (2008). An Introduction to Survival Analysis Using Stata. College Station, TX: Stata Press. [Google Scholar]
- Clough E., Barrett T. (2016). The gene expression omnibus database. Stat. Genom. 1418, 93–110. 10.1007/978-1-4939-3578-9_5 [DOI] [PMC free article] [PubMed] [Google Scholar]
- D'Agostino R. B., Nam B.-H. (2003). Evaluation of the performance of survival analysis models: discrimination and calibration measures. Handb. Stat. 23, 1–25. 10.1016/S0169-7161(03)23001-7 [DOI] [Google Scholar]
- Davidson-Pilon C. (2019). Lifelines: survival analysis in python. J. Open Source Softw. 4:1317. 10.21105/joss.01317 [DOI] [Google Scholar]
- Deepa P., Gunavathi C. (2022). A systematic review on machine learning and deep learning techniques in cancer survival prediction. Progr. Biophys. Mol. Biol. 174, 62–71. 10.1016/j.pbiomolbio.2022.07.004 [DOI] [PubMed] [Google Scholar]
- Degenhardt F., Seifert S., Szymczak S. (2019). Evaluation of variable selection methods for random forests and omics data sets. Brief. Bioinformat. 20, 492–503. 10.1093/bib/bbx124 [DOI] [PMC free article] [PubMed] [Google Scholar]
- Doja M., Kaur I., Ahmad T. (2020). Age-specific survival in prostate cancer using machine learning. Data Technol. Appl. 54, 215–234. 10.1108/DTA-10-2019-0189 [DOI] [Google Scholar]
- Dong G., Liu H. (2018). Feature Engineering for Machine Learning and Data Analytics. CRC Press. [Google Scholar]
- Driscoll J. J., Rixe O. (2009). Overall survival: still the gold standard: why overall survival remains the definitive end point in cancer clinical trials. Cancer J. 15, 401–405. 10.1097/PPO.0b013e3181bdc2e0 [DOI] [PubMed] [Google Scholar]
- Du J., Yan X., Mi S., Li Y., Ji H., Hou K., et al. (2020). Identification of prognostic model and biomarkers for cancer stem cell characteristics in glioblastoma by network analysis of multi-omics data and stemness indices. Front. Cell Dev. Biol. 8:558961. 10.3389/fcell.2020.558961 [DOI] [PMC free article] [PubMed] [Google Scholar]
- Dwivedi R., Dave D., Naik H., Singhal S., Omer R., Patel P., et al. (2023). Explainable AI (XAI): core ideas, techniques, and solutions. ACM Comp. Surv. 55, 1–33. 10.1145/3561048 [DOI] [Google Scholar]
- Eckardt J.-N., Röllig C., Metzeler K., Kramer M., Stasik S., Georgi J.-A., et al. (2023). Prediction of complete remission and survival in acute myeloid leukemia using supervised machine learning. Haematologica 108:690. 10.3324/haematol.2021.280027 [DOI] [PMC free article] [PubMed] [Google Scholar]
- Ellen J. G., Jacob E., Nikolaou N., Markuzon N. (2023). Autoencoder-based multimodal prediction of non-small cell lung cancer survival. Sci. Rep. 13:15761. 10.1038/s41598-023-42365-x [DOI] [PMC free article] [PubMed] [Google Scholar]
- Fala S. Y., Osman M. (2023). Machine learning-based model for survival prediction after immunotherapy in patients with solid tumor. Cancer Res. 83 (7_Suppl.), 4298–4298. 10.1158/1538-7445.AM2023-4298 [DOI] [Google Scholar]
- Fan Z., Jiang Z., Liang H., Han C. (2023). Pancancer survival prediction using a deep learning architecture with multimodal representation and integration. Bioinformat. Adv. 3:vbad006. 10.1093/bioadv/vbad006 [DOI] [PMC free article] [PubMed] [Google Scholar]
- Farahani N. Z., Enayati M., Pumarejo A., Aguirre M. A., Scott C., Siontis K., et al. (2023). Arrhythmic sudden death survival prediction model for hypertrophic cardiomyopathy patients: an interpretable machine learning analysis. Front. Biomed. Devices 86731:V001T01A004. 10.1115/DMD2023-2989 [DOI] [Google Scholar]
- Farrokhi M., Taheri F., Khouzani P. J., Rahmani E., Tavakoli R., Fard A. M., et al. (2023). Role of precision medicine and personalized medicine in the treatment of diseases. Kindle 3, 1–164. [Google Scholar]
- Feldner-Busztin D., Firbas Nisantzis P., Edmunds S. J., Boza G., Racimo F., Gopalakrishnan S., et al. (2023). Dealing with dimensionality: the application of machine learning to multi-omics data. Bioinformatics 39:btad021. 10.1093/bioinformatics/btad021 [DOI] [PMC free article] [PubMed] [Google Scholar]
- Feng Y., Leung A. A., Lu X., Liang Z., Quan H., Walker R. L. (2022). Personalized prediction of incident hospitalization for cardiovascular disease in patients with hypertension using machine learning. BMC Med. Res. Methodol. 22, 1–11. 10.1186/s12874-022-01814-3 [DOI] [PMC free article] [PubMed] [Google Scholar]
- Fiteni F., Westeel V., Pivot X., Borg C., Vernerey D., Bonnetain F. (2014). Endpoints in cancer clinical trials. J. Visc. Surg. 151, 17–22. 10.1016/j.jviscsurg.2013.10.001 [DOI] [PubMed] [Google Scholar]
- Fornili M., Ambrogi F., Boracchi P., Biganzoli E. (2014). “Piecewise exponential artificial neural networks (peann) for modeling hazard function with right censored data,” in Computational Intelligence Methods for Bioinformatics and Biostatistics: 10th International Meeting, CIBB 2013, Nice, France, June 20-22, 2013, Revised Selected Papers 10 (Cham: Springer; ), 125–136. [Google Scholar]
- Fotso S. (2018). Deep neural networks for survival analysis based on a multi-task framework. arXiv [preprint]. 10.48550/arXiv.1801.05512 [DOI] [Google Scholar]
- Fotso S. (2019). PySurvival: Open Source Package for Survival Analysis Modeling. [Google Scholar]
- García-Laencina P. J., Abreu P. H., Abreu M. H., Afonoso N. (2015). Missing data imputation on the 5-year survival prediction of breast cancer patients with unknown discrete values. Comput. Biol. Med. 59, 125–133. 10.1016/j.compbiomed.2015.02.006 [DOI] [PubMed] [Google Scholar]
- Gastinel L. N. (2012). Principal Component Analysis in the Era of « Omics» Data. Principle Component Analysis—Multidisciplinary Applications. Rijeka: InTech, 21–42. [Google Scholar]
- Gensheimer M. F., Narasimhan B. (2019). A scalable discrete-time survival model for neural networks. PeerJ 7:e6257. 10.7717/peerj.6257 [DOI] [PMC free article] [PubMed] [Google Scholar]
- Gerds T. A., Schumacher M. (2006). Consistent estimation of the expected brier score in general survival models with right-censored event times. Biom. J. 48, 1029–1040. 10.1002/bimj.200610301 [DOI] [PubMed] [Google Scholar]
- Glare P., Virik K., Jones M., Hudson M., Eychmuller S., Simes J., et al. (2003). A systematic review of physicians' survival predictions in terminally ill cancer patients. BMJ 327:195. 10.1136/bmj.327.7408.195 [DOI] [PMC free article] [PubMed] [Google Scholar]
- Goldman M., Craft B., Hastie M., Repečka K., McDade F., Kamath A., et al. (2018). The ucsc xena platform for public and private cancer genomics data visualization and interpretation. biorxiv 326470. 10.1101/326470 [DOI] [Google Scholar]
- Grever M. R., Schepartz S. A., Chabner B. A. (1992). The national cancer institute: cancer drug discovery and development program. Semin. Oncol. 19, 622–638. [PubMed] [Google Scholar]
- Guan F., Ni T., Zhu W., Williams L. K., Cui L.-B., Li M., et al. (2022). Integrative omics of schizophrenia: from genetic determinants to clinical classification and risk prediction. Mol. Psychiatry 27, 113–126. 10.1038/s41380-021-01201-2 [DOI] [PMC free article] [PubMed] [Google Scholar]
- Gupta V., Coburn N., Kidane B., Hess K. R., Compton C., Ringash J., et al. (2018). Survival prediction tools for esophageal and gastroesophageal junction cancer: a systematic review. J. Thorac. Cardiovasc. Surg. 156, 847–856. 10.1016/j.jtcvs.2018.03.146 [DOI] [PubMed] [Google Scholar]
- Gyawali B., Eisenhauer E., Tregear M., Booth C. M. (2022). Progression-free survival: it is time for a new name. Lancet Oncol. 23, 328–330. 10.1016/S1470-2045(22)00015-8 [DOI] [PubMed] [Google Scholar]
- Haendel M., Vasilevsky N., Unni D., Bologa C., Harris N., Rehm H., et al. (2020). How many rare diseases are there? Nat. Rev. Drug Discov. 19, 77–78. 10.1038/d41573-019-00180-y [DOI] [PMC free article] [PubMed] [Google Scholar]
- Han M., He J., Jiao X. (2022). “Research on prognostic risk assessment algorithm based on graph neural networks and attention mechanisms,” in 2022 International Conference on Information Technology, Communication Ecosystem and Management (ITCEM) (New York, NY: IEEE; ), 101–106. [Google Scholar]
- Hao Y., Jing X.-Y., Sun Q. (2023). Cancer survival prediction by learning comprehensive deep feature representation for multiple types of genetic data. BMC bioinformatics 24, 267. 10.21203/rs.3.rs-2560223/v1 [DOI] [PMC free article] [PubMed] [Google Scholar]
- Hartman N., Kim S., He K., Kalbfleisch J. D. (2023). Pitfalls of the concordance index for survival outcomes. Stat. Med. 42, 2179–2190. 10.1002/sim.9717 [DOI] [PMC free article] [PubMed] [Google Scholar]
- Hathaway Q., Yanamala N., Budoff M., Sengupta P., Zeby I. (2021). Cardiovascular risk stratification through deep neural survival networks-the multi-ethnic study of atherosclerosis (mesa). J. Am. Coll. Cardiol. 77(18_Suppl_1), 561–561. 10.1016/S0735-1097(21)01920-3 [DOI] [PubMed] [Google Scholar]
- Hathaway Q. A., Yanamala N., Budoff M. J., Sengupta P. P., Zeb I. (2021). Deep neural survival networks for cardiovascular risk prediction: The multi-ethnic study of atherosclerosis (mesa). Comput. Biol. Med. 139:104983. 10.1016/j.compbiomed.2021.104983 [DOI] [PubMed] [Google Scholar]
- Heagerty P. J., Lumley T., Pepe M. S. (2000). Time-dependent roc curves for censored survival data and a diagnostic marker. Biometrics 56, 337–344. 10.1111/j.0006-341X.2000.00337.x [DOI] [PubMed] [Google Scholar]
- Herrmann M., Probst P., Hornung R., Jurinovic V., Boulesteix A.-L. (2021). Large-scale benchmark study of survival prediction methods using multi-omics data. Brief. Bioinformat. 22:bbaa167. 10.1093/bib/bbaa167 [DOI] [PMC free article] [PubMed] [Google Scholar]
- Hira M. T., Razzaque M., Angione C., Scrivens J., Sawan S., Sarker M. (2021). Integrated multi-omics analysis of ovarian cancer using variational autoencoders. Sci. Rep. 11:6265. 10.1038/s41598-021-85285-4 [DOI] [PMC free article] [PubMed] [Google Scholar]
- Hu Q., Wang Y., Zhang Y., Ge Y., Yin Y., Zhu H. (2021a). A new HPV score system predicts the survival of patients with cervical cancers. Front. Genet. 12:747090. 10.3389/fgene.2021.747090 [DOI] [PMC free article] [PubMed] [Google Scholar]
- Hu S., Fridgeirsson E., van Wingen G., Welling M. (2021b). “Transformer-based deep survival analysis,” in Survival Prediction-Algorithms, Challenges and Applications (PMLR, AAAI Spring Symposium Series California: ), 132–148. [Google Scholar]
- Ishak K. J., Kreif N., Benedict A., Muszbek N. (2013). Overview of parametric survival analysis for health-economic applications. Pharmacoeconomics 31, 663–675. 10.1007/s40273-013-0064-3 [DOI] [PubMed] [Google Scholar]
- Ishwaran H., Kogalur U. B., Blackstone E. H., Lauer M. S. (2008). Random survival forests. Ann. Appl. Stat. 2, 841–860. 10.1214/08-AOAS169 [DOI] [Google Scholar]
- Jackson C. H. (2016). flexsurv: a platform for parametric survival modeling in R. J. Stat. Softw. 70:i08. 10.18637/jss.v070.i08 [DOI] [PMC free article] [PubMed] [Google Scholar]
- Jamison D. T. (2018). Disease control priorities: improving health and reducing poverty. Lancet 391, e11—e14. 10.1016/S0140-6736(15)60097-6 [DOI] [PubMed] [Google Scholar]
- Jensen M. A., Ferretti V., Grossman R. L., Staudt L. M. (2017). The NCI genomic data commons as an engine for precision medicine. Blood 130, 453–459. 10.1182/blood-2017-03-735654 [DOI] [PMC free article] [PubMed] [Google Scholar]
- Jiang A., Bao Y., Wang A., Gong W., Gan X., Wang J., et al. (2022). Establishment of a prognostic prediction and drug selection model for patients with clear cell renal cell carcinoma by multiomics data analysis. Oxid. Med. Cell. Longev. 2022:3617775. 10.1155/2022/3617775 [DOI] [PMC free article] [PubMed] [Google Scholar]
- Jiang F., Jiang Y., Zhi H., Dong Y., Li H., Ma S., et al. (2017). Artificial intelligence in healthcare: past, present and future. Stroke Vasc. Neurol. 2:101. 10.1136/svn-2017-000101 [DOI] [PMC free article] [PubMed] [Google Scholar]
- Jiang Y., Alford K., Ketchum F., Tong L., Wang M. D. (2020). ‘TLSurv: integrating multi-omics data by multi-stage transfer learning for cancer survival prediction,” in Proceedings of the 11th ACM International Conference on Bioinformatics, Computational Biology and Health Informatics (ACM), 1–10. [Google Scholar]
- Jiang Z. (2022). CoxNAMS: Interpretable Deep Learning Model for Survival Analysis (Master's thesis: ). ETH Zurich. [Google Scholar]
- Jung J.-O., Crnovrsanin N., Wirsik N. M., Nienhüser H., Peters L., Popp F., et al. (2023). Machine learning for optimized individual survival prediction in resectable upper gastrointestinal cancer. J. Cancer Res. Clin. Oncol. 149, 1691–1702. 10.1007/s00432-022-04063-5 [DOI] [PMC free article] [PubMed] [Google Scholar]
- Kamps R., Brandão R. D., van den Bosch B. J., Paulussen A. D., Xanthoulea S., Blok M. J., et al. (2017). Next-generation sequencing in oncology: genetic diagnosis, risk prediction and cancer classification. Int. J. Mol. Sci. 18:308. 10.3390/ijms18020308 [DOI] [PMC free article] [PubMed] [Google Scholar]
- Kantidakis G., Hazewinkel A.-D., Fiocco M. (2022). Neural networks for survival prediction in medicine using prognostic factors: a review and critical appraisal. Comput. Math. Methods Med. 2022:1176060. 10.1155/2022/1176060 [DOI] [PMC free article] [PubMed] [Google Scholar]
- Kantidakis G., Putter H., Lancia C., de Boer J., Braat A. E., Fiocco M., et al. (2020). Survival prediction models since liver transplantation-comparisons between Cox models and machine learning techniques. BMC Med. Res. Methodol. 20, 1–14. 10.1186/s12874-020-01153-1 [DOI] [PMC free article] [PubMed] [Google Scholar]
- Katzman J. L., Shaham U., Cloninger A., Bates J., Jiang T., Kluger Y. (2018). DeepSurv: personalized treatment recommender system using a cox proportional hazards deep neural network. BMC Med. Res. Methodol. 18, 1–12. 10.1186/s12874-018-0482-1 [DOI] [PMC free article] [PubMed] [Google Scholar]
- Kaur I., Doja M., Ahmad T. (2022). Data mining and machine learning in cancer survival research: an overview and future recommendations. J. Biomed. Inform. 128:104026. 10.1016/j.jbi.2022.104026 [DOI] [PubMed] [Google Scholar]
- Kazerooni A. F., Saxena S., Toorens E., Tu D., Bashyam V., Akbari H., et al. (2021). Multi-omic prediction of overall survival in patients with glioblastoma: additive and synergistic value of clinical measures, radiomics, and genomics. Nat. Sci. Rep. 10.21203/rs.3.rs-908405/v1 [DOI] [PMC free article] [PubMed] [Google Scholar]
- Khan F. M., Zubek V. B. (2008). “Support vector regression for censored data (SVRc): a novel tool for survival analysis,” in 2008 Eighth IEEE International Conference on Data Mining (New Jersey, NJ: IEEE; ), 863–868. [Google Scholar]
- Kim S. Y. (2023). GNN-surv: discrete-time survival prediction using graph neural networks. Bioengineering 10:1046. 10.3390/bioengineering10091046 [DOI] [PMC free article] [PubMed] [Google Scholar]
- Kirpich A., Ainsworth E. A., Wedow J. M., Newman J. R., Michailidis G., McIntyre L. M. (2018). Variable selection in omics data: a practical evaluation of small sample sizes. PLoS ONE 13:e0197910. 10.1371/journal.pone.0197910 [DOI] [PMC free article] [PubMed] [Google Scholar]
- Kleinbaum D. G., Klein M. (1996). Survival Analysis a Self-Learning Text. New York, NY: Springer. [Google Scholar]
- Kosorok M. R., Laber E. B. (2019). Precision medicine. Ann. Rev. Stat. Appl. 6, 263–286. 10.1146/annurev-statistics-030718-105251 [DOI] [PMC free article] [PubMed] [Google Scholar]
- Kourou K., Exarchos T. P., Exarchos K. P., Karamouzis M. V., Fotiadis D. I. (2015). Machine learning applications in cancer prognosis and prediction. Comput. Struct. Biotechnol. J. 13, 8–17. 10.1016/j.csbj.2014.11.005 [DOI] [PMC free article] [PubMed] [Google Scholar]
- Kresoja K.-P., Unterhuber M., Wachter R., Thiele H., Lurz P. (2023). A cardiologist's guide to machine learning in cardiovascular disease prognosis prediction. Basic Res. Cardiol. 118:10. 10.1007/s00395-023-00982-7 [DOI] [PMC free article] [PubMed] [Google Scholar]
- Krzyziński M., Spytek M., Baniecki H., Biecek P. (2023). SurvSHAP (t): time-dependent explanations of machine learning survival models. Knowl. Based Syst. 262:110234. 10.1016/j.knosys.2022.11023438847519 [DOI] [Google Scholar]
- Kubi M. G., Lasisi K., Rasheed B. A. (2022). Parametric and semi-parametric survival models with application to diabetes data. Sci. J. Biomed. Eng. Biomed. Sci. 3, 001–010. [Google Scholar]
- Kvamme H., Borgan Ø. (2019a). The brier score under administrative censoring: problems and solutions. arXiv [preprint]. 10.48550/arXiv.1912.08581 [DOI] [Google Scholar]
- Kvamme H., Borgan Ø. (2019b). Continuous and discrete-time survival prediction with neural networks. arXiv [preprint]. 10.48550/arXiv.1910.06724 [DOI] [PMC free article] [PubMed] [Google Scholar]
- Kvamme H., Borgan Ø. (2021). Continuous and discrete-time survival prediction with neural networks. Lifetime Data Anal. 27, 710–736. 10.1007/s10985-021-09532-6 [DOI] [PMC free article] [PubMed] [Google Scholar]
- Kvamme H., Borgan Ø., Scheel I. (2019). Time-to-event prediction with neural networks and cox regression. arXiv [preprint]. 10.48550/arXiv.1907.00825 [DOI] [Google Scholar]
- Lang T., Yang M., Xia Y., Liu J., Li Y., Yang L., et al. (2023). Development of a molecular feature-based survival prediction model of ovarian cancer using the deep neural network. Genes Dis. 10:1190. 10.1016/j.gendis.2022.10.011 [DOI] [PMC free article] [PubMed] [Google Scholar]
- LeCun Y., Bengio Y., Hinton G. (2015). Deep learning. Nature 521, 436–444. 10.1038/nature14539 [DOI] [PubMed] [Google Scholar]
- Lee C., Zame W., Yoon J., Van Der Schaar M. (2018). Deephit: a deep learning approach to survival analysis with competing risks. Proc. AAAI Conf. Artif. Intell. 32:11842. 10.1609/aaai.v32i1.1184230951460 [DOI] [Google Scholar]
- Lee C.-J., Baek B., Cho S. H., Jang T.-Y., Jeon S.-E., Lee S., et al. (2023). Machine learning with in silico analysis markedly improves survival prediction modeling in colon cancer patients. Cancer Med. 12, 7603–7615. 10.1002/cam4.5420 [DOI] [PMC free article] [PubMed] [Google Scholar]
- Lee E. T., Wang J. (2003). Statistical Methods for Survival Data Analysis, Volume 476. Hoboken, NJ: John Wiley & Sons. [Google Scholar]
- Lee S., Lim H. (2019). Review of statistical methods for survival analysis using genomic data. Genom. Inf. 17:e41. 10.5808/GI.2019.17.4.e41 [DOI] [PMC free article] [PubMed] [Google Scholar]
- Lee T.-Y., Huang K.-Y., Chuang C.-H., Lee C.-Y., Chang T.-H. (2020). Incorporating deep learning and multi-omics autoencoding for analysis of lung adenocarcinoma prognostication. Comput. Biol. Chem. 87:107277. 10.1016/j.compbiolchem.2020.107277 [DOI] [PubMed] [Google Scholar]
- Leung K.-M., Elashoff R. M., Afifi A. A. (1997). Censoring issues in survival analysis. Annu. Rev. Public Health 18, 83–104. 10.1146/annurev.publhealth.18.1.83 [DOI] [PubMed] [Google Scholar]
- Li R., Wang S., Cui Y., Qu H., Chater J. M., Zhang L., et al. (2021). Extended application of genomic selection to screen multiomics data for prognostic signatures of prostate cancer. Brief. Bioinformat. 22:bbaa197. 10.1093/bib/bbaa197 [DOI] [PubMed] [Google Scholar]
- Li X., Chen Y., Sun A., Wang Y., Liu Y., Lei H. (2023). Development and validation of prediction model for overall survival in patients with lymphoma: a prospective cohort study in china. BMC Med. Inform. Decis. Mak. 23, 1–11. 10.1186/s12911-023-02198-0 [DOI] [PMC free article] [PubMed] [Google Scholar]
- Li Y., Sun R., Zhang Y., Yuan Y., Miao Y. (2020). A methylation-based mRNA signature predicts survival in patients with gastric cancer. Cancer Cell Int. 20, 1–10. 10.1186/s12935-020-01374-w [DOI] [PMC free article] [PubMed] [Google Scholar]
- Liberzon A., Subramanian A., Pinchback R., Thorvaldsdóttir H., Tamayo P., Mesirov J. P. (2011). Molecular signatures database (MSigDB) 3.0. Bioinformatics 27, 1739–1740. 10.1093/bioinformatics/btr260 [DOI] [PMC free article] [PubMed] [Google Scholar]
- Lin Z., He Y., Qiu C., Yu Q., Huang H., Zhang Y., et al. (2022). A multi-omics signature to predict the prognosis of invasive ductal carcinoma of the breast. Comput. Biol. Med. 151:106291. 10.1016/j.compbiomed.2022.106291 [DOI] [PubMed] [Google Scholar]
- Liu J., Lichtenberg T., Hoadley K. A., Poisson L. M., Lazar A. J., Cherniack A. D., et al. (2018). An integrated TCGA pan-cancer clinical data resource to drive high-quality survival outcome analytics. Cell 173, 400–416. 10.1016/j.cell.2018.02.052 [DOI] [PMC free article] [PubMed] [Google Scholar]
- Lun Y., Yuan H., Ma P., Chen J., Lu P., Wang W., et al. (2024). A prediction model based on random survival forest analysis of the overall survival of elderly female papillary thyroid carcinoma patients: a seer-based study. Endocrine 1–9. 10.1007/s12020-024-03797-1 [DOI] [PubMed] [Google Scholar]
- Lv J., Wang J., Shang X., Liu F., Guo S. (2020). Survival prediction in patients with colon adenocarcinoma via multiomics data integration using a deep learning algorithm. Biosci. Rep. 40:BSR20201482. 10.1042/BSR20201482 [DOI] [PMC free article] [PubMed] [Google Scholar]
- Lynch C. M., Abdollahi B., Fuqua J. D., De Carlo A. R., Bartholomai J. A., Balgemann R. N., et al. (2017). Prediction of lung cancer patient survival via supervised machine learning classification techniques. Int. J. Med. Inform. 108, 1–8. 10.1016/j.ijmedinf.2017.09.013 [DOI] [PMC free article] [PubMed] [Google Scholar]
- Ma B., Yan G., Chai B., Hou X. (2022). XGBLC: an improved survival prediction model based on XGBoost. Bioinformatics 38, 410–418. 10.1093/bioinformatics/btab675 [DOI] [PubMed] [Google Scholar]
- Majji R., Rajeswari R., Vidyadhari C., Cristin R. (2023). Squirrel search deer hunting-based deep recurrent neural network for survival prediction using pan-cancer gene expression data. Comp. J. 66, 245–266. 10.1093/comjnl/bxab158 [DOI] [Google Scholar]
- Malik V., Kalakoti Y., Sundar D. (2021). Deep learning assisted multi-omics integration for survival and drug-response prediction in breast cancer. BMC Genom. 22, 1–11. 10.1186/s12864-021-07524-2 [DOI] [PMC free article] [PubMed] [Google Scholar]
- Manganaro L., Sabbatini G., Bianco S., Bironzo P., Borile C., Colombi D., et al. (2023). Non-small cell lung cancer survival estimation through multi-omic two-layer SVM: a multi-omics and multi-sources integrative model. Curr. Bioinform. 18, 658–669. 10.2174/1574893618666230502102712 [DOI] [Google Scholar]
- McKinney W., Perktold J., Seabold S. (2011). Time series analysis in python with statsmodels. Jarrodmillman Com. 96–102. 10.25080/Majora-ebaa42b7-012 [DOI] [Google Scholar]
- Miao S., Lei H., Li X., Zhou W., Wang G., Sun A., et al. (2022). Development and validation of a risk prediction model for overall survival in patients with nasopharyngeal carcinoma: a prospective cohort study in china. Cancer Cell Int. 22, 1–11. 10.1186/s12935-022-02776-8 [DOI] [PMC free article] [PubMed] [Google Scholar]
- Mirbabaie M., Stieglitz S., Frick N. R. (2021). Artificial intelligence in disease diagnostics: a critical review and classification on the current state of research guiding future direction. Health Technol. 11, 693–731. 10.1007/s12553-021-00555-5 [DOI] [Google Scholar]
- Misra B. B., Langefeld C., Olivier M., Cox L. A. (2019). Integrated omics: tools, advances and future approaches. J. Mol. Endocrinol. 62, R21—R45. 10.1530/JME-18-0055 [DOI] [PubMed] [Google Scholar]
- Mo L., Su Y., Yuan J., Xiao Z., Zhang Z., Lan X., et al. (2022). Comparisons of forecasting for survival outcome for head and neck squamous cell carcinoma by using machine learning models based on multi-omics. Curr. Genom. 23:94. 10.2174/1389202923666220204153744 [DOI] [PMC free article] [PubMed] [Google Scholar]
- Moher D., Liberati A., Tetzlaff J., Altman D. G., Group P., et al. (2010). Preferred reporting items for systematic reviews and meta-analyses: the prisma statement. Int. J. Surg. 8, 336–341. 10.1016/j.ijsu.2010.02.007 [DOI] [PubMed] [Google Scholar]
- Moreno-Sanchez P. A. (2023). Improvement of a prediction model for heart failure survival through explainable artificial intelligence. Front. Cardiovasc. Med. 10:1219586. 10.3389/fcvm.2023.1219586 [DOI] [PMC free article] [PubMed] [Google Scholar]
- Murphy S. (1995). Likelihood ratio-based confidence intervals in survival analysis. J. Am. Stat. Assoc. 90, 1399–1405. 10.1080/01621459.1995.10476645 [DOI] [Google Scholar]
- Murthy D. P., Xie M., Jiang R. (2004). Weibull Models. Hoboken, NJ: John Wiley & Sons. [Google Scholar]
- Nariya M. K., Mills C. E., Sorger P. K., Sokolov A. (2023). Paired evaluation of machine-learning models characterizes effects of confounders and outliers. Patterns 4:100791. 10.1016/j.patter.2023.100791 [DOI] [PMC free article] [PubMed] [Google Scholar]
- National Research Council (US) (2010). Research at the Intersection of the Physical and Life Sciences. Washington, DC. [Google Scholar]
- Ni A., Qin L.-X. (2021). Performance evaluation of transcriptomics data normalization for survival risk prediction. Brief. Bioinf. 22:bbab257. 10.1093/bib/bbab257 [DOI] [PMC free article] [PubMed] [Google Scholar]
- Othman N. A., Abdel-Fattah M. A., Ali A. T. (2023). A hybrid deep learning framework with decision-level fusion for breast cancer survival prediction. Big Data Cogn. Comp. 7:50. 10.3390/bdcc7010050 [DOI] [Google Scholar]
- Owens A. R., McInerney C. E., Prise K. M., McArt D. G., Jurek-Loughrey A. (2021). Novel deep learning-based solution for identification of prognostic subgroups in liver cancer (hepatocellular carcinoma). BMC Bioinform. 22, 1–22. 10.1186/s12859-021-04454-4 [DOI] [PMC free article] [PubMed] [Google Scholar]
- Palmal S., Arya N., Saha S., Tripathy S. (2023). Breast cancer survival prognosis using the graph convolutional network with choquet fuzzy integral. Sci. Rep. 13:14757. 10.1038/s41598-023-40341-z [DOI] [PMC free article] [PubMed] [Google Scholar]
- Pant S., Kang S.-R., Lee M., Phuc P.-S., Yang H.-J., Yang D.-H. (2023). Survival prediction using transformer-based categorical feature representation in the treatment of diffuse large b-cell lymphoma. Healthcare 11:1171. 10.3390/healthcare11081171 [DOI] [PMC free article] [PubMed] [Google Scholar]
- Pawar A., Chowdhury O. R., Chauhan R., Talole S., Bhattacharjee A. (2022). Identification of key gene signatures for the overall survival of ovarian cancer. J. Ovar. Res. 15, 1–13. 10.1186/s13048-022-00942-0 [DOI] [PMC free article] [PubMed] [Google Scholar]
- Pellegrini M. (2023). Accurate prognosis for localized prostate cancer through coherent voting networks with multi-omic and clinical data. Sci. Rep. 13:7875. 10.1038/s41598-023-35023-9 [DOI] [PMC free article] [PubMed] [Google Scholar]
- Pobar I., Job M., Holt T., Hargrave C., Hickey B. (2021). Prognostic tools for survival prediction in advanced cancer patients: a systematic review. J. Med. Imaging Radiat. Oncol. 65, 806–816. 10.1111/1754-9485.13185 [DOI] [PubMed] [Google Scholar]
- Poirion O. B., Jing Z., Chaudhary K., Huang S., Garmire L. X. (2021). Deepprog: an ensemble of deep-learning and machine-learning models for prognosis prediction using multi-omics data. Genome Med. 13, 1–15. 10.1186/s13073-021-00930-x [DOI] [PMC free article] [PubMed] [Google Scholar]
- Pölsterl S. (2020). scikit-survival: a library for time-to-event analysis built on top of scikit-learn. J. Mach. Learn. Res. 21, 8747–8752. [Google Scholar]
- Qian X., Keerman M., Zhang X., Guo H., He J., Maimaitijiang R., et al. (2023). Study on the prediction model of atherosclerotic cardiovascular disease in the rural xinjiang population based on survival analysis. BMC Public Health 23, 1–11. 10.1186/s12889-023-15630-x [DOI] [PMC free article] [PubMed] [Google Scholar]
- Rahimi M., Akbari A., Asadi F., Emami H. (2023). Cervical cancer survival prediction by machine learning algorithms: a systematic. BMC Cancer 23:341. 10.1186/s12885-023-10808-3 [DOI] [PMC free article] [PubMed] [Google Scholar]
- Rahman S. A., Walker R. C., Maynard N., Trudgill N., Crosby T., Cromwell D. A., et al. (2023). The augis survival predictor: prediction of long-term and conditional survival after esophagectomy using random survival forests. Ann. Surg. 277, 267–274. 10.1097/SLA.0000000000004794 [DOI] [PMC free article] [PubMed] [Google Scholar]
- Raju J., Sathyalakshmi S. (2023). “Long-term survival prediction of liver transplantation using deep learning techniques,” in 2023 2nd International Conference on Computational Systems and Communication (ICCSC) (New Jersey, NJ: IEEE; ), 1–6. [Google Scholar]
- Raufaste-Cazavieille V., Santiago R., Droit A. (2022). Multi-omics analysis: paving the path toward achieving precision medicine in cancer treatment and immuno-oncology. Front. Mol. Biosci. 9:962743. 10.3389/fmolb.2022.962743 [DOI] [PMC free article] [PubMed] [Google Scholar]
- Redekar S. S., Varma S. L., Bhattacharjee A. (2022). Identification of key genes associated with survival of glioblastoma multiforme using integrated analysis of tcga datasets. Comp. Methods Progr. Biomed. Update 2:100051. 10.1016/j.cmpbup.2022.10005132874133 [DOI] [Google Scholar]
- Richard V. R., Gaither C., Popp R., Chaplygina D., Brzhozovskiy A., Kononikhin A., et al. (2022). Early prediction of covid-19 patient survival by targeted plasma multi-omics and machine learning. Mol. Cell. Proteom. 21:100277. 10.1016/j.mcpro.2022.100277 [DOI] [PMC free article] [PubMed] [Google Scholar]
- Salerno S., Li Y. (2023). High-dimensional survival analysis: methods and applications. Ann. Rev. Stat. Appl. 10, 25–49. 10.1146/annurev-statistics-032921-022127 [DOI] [PMC free article] [PubMed] [Google Scholar]
- Sargent D. J., Wieand H. S., Haller D. G., Gray R., Benedetti J. K., Buyse M., et al. (2005). Disease-free survival versus overall survival as a primary end point for adjuvant colon cancer studies: individual patient data from 20,898 patients on 18 randomized trials. J. Clin. Oncol. 23, 8664–8670. 10.1200/JCO.2005.01.6071 [DOI] [PubMed] [Google Scholar]
- Sarma A., Calfee C. S., Ware L. B. (2020). Biomarkers and precision medicine: state of the art. Crit. Care Clin. 36, 155–165. 10.1016/j.ccc.2019.08.012 [DOI] [PubMed] [Google Scholar]
- Schumacher M., Graf E., Gerds T. (2003). How to assess prognostic models for survival data: a case study in oncology. Methods Inf. Med. 42, 564–571. 10.1055/s-0038-1634384 [DOI] [PubMed] [Google Scholar]
- Sellin J. A. (2015). Does one size fit all? Patents, the right to health and access to medicines. Netherlands Int. Law Rev. 62, 445–473. 10.1007/s40802-015-0047-5 [DOI] [Google Scholar]
- Shen J., Zhang C. J., Jiang B., Chen J., Song J., Liu Z., et al. (2019). Artificial intelligence versus clinicians in disease diagnosis: systematic review. JMIR Med. Inf. 7:e10010. 10.2196/10010 [DOI] [PMC free article] [PubMed] [Google Scholar]
- Shetty K. S., Jose A., Bani M., Vinod P. (2023). Network diffusion-based approach for survival prediction and identification of biomarkers using multi-omics data of papillary renal cell carcinoma. Mol. Genet. Genom. 298, 1–12. 10.1007/s00438-023-02022-4 [DOI] [PubMed] [Google Scholar]
- Shivaswamy P. K., Chu W., Jansche M. (2007). “A support vector approach to censored targets,” in Seventh IEEE International Conference on Data Mining (ICDM 2007) (New Jersey, NJ: IEEE; ), 655–660. [Google Scholar]
- Simino J. M. (2009). Discrimination and Calibration of Prognostic Survival Models. The Florida State University. [Google Scholar]
- Sinha D., Dey D. K. (1997). Semiparametric bayesian analysis of survival data. J. Am. Stat. Assoc. 92, 1195–1212. 10.1080/01621459.1997.10474077 [DOI] [Google Scholar]
- Sonabend R., Király F. J., Bender A., Bischl B., Lang M. (2021). mlr3proba: an R package for machine learning in survival analysis. Bioinformatics 37, 2789–2791. 10.1093/bioinformatics/btab039 [DOI] [PMC free article] [PubMed] [Google Scholar]
- Spytek M., Krzyziński M., Langbein S. H., Baniecki H., Wright M. N., Biecek P. (2023). survex: an R package for explaining machine learning survival models. arXiv [preprint]. arXiv:2308.16113. 10.1093/bioinformatics/btad723 [DOI] [PMC free article] [PubMed] [Google Scholar]
- Stanfill A. G., Cao X. (2021). Enhancing research through the use of the genotype-tissue expression (gtex) database. Biol. Res. Nurs. 23, 533–540. 10.1177/1099800421994186 [DOI] [PMC free article] [PubMed] [Google Scholar]
- Stevenson M., EpiCentre I. (2009). An Introduction to Survival Analysis. Palmerston North: EpiCentre, IVABS, Massey University. [Google Scholar]
- Tan K., Huang W., Hu J., Dong S. (2020). A multi-omics supervised autoencoder for pan-cancer clinical outcome endpoints prediction. BMC Med. Inform. Decis. Mak. 20, 1–9. 10.1186/s12911-020-1114-3 [DOI] [PMC free article] [PubMed] [Google Scholar]
- Tang C., Yu M., Ma J., Zhu Y. (2021). Metabolic classification of bladder cancer based on multi-omics integrated analysis to predict patient prognosis and treatment response. J. Transl. Med. 19, 1–15. 10.1186/s12967-021-02865-8 [DOI] [PMC free article] [PubMed] [Google Scholar]
- Tarango R., Hadjiiski L., Alva A., Chan H.-P., Cohan R. H., Caoili E. M., et al. (2023). Survival prediction for patients with metastatic urothelial cancer after immunotherapy using machine learning. Med. Imaging 12465, 779–784. 10.1117/12.265548233650265 [DOI] [Google Scholar]
- Tarkhan A., Simon N., Bengtsson T., Nguyen K., Dai J. (2021). “Survival prediction using deep learning,” in Survival Prediction-Algorithms, Challenges and Applications (PMLR, AAAI Spring Symposium Series California: ), 207–214. [Google Scholar]
- Terrematte P., Andrade D. S., Justino J., Stransky B., de Araújo D. S. A., Dória Neto A. D. (2022). A novel machine learning 13-gene signature: Improving risk analysis and survival prediction for clear cell renal cell carcinoma patients. Cancers 14:2111. 10.3390/cancers14092111 [DOI] [PMC free article] [PubMed] [Google Scholar]
- Tewarie I. A., Senders J. T., Kremer S., Devi S., Gormley W. B., Arnaout O., et al. (2021). Survival prediction of glioblastoma patients—are we there yet? A systematic review of prognostic modeling for glioblastoma and its clinical potential. Neurosurg. Rev. 44, 2047–2057. 10.1007/s10143-020-01430-z [DOI] [PMC free article] [PubMed] [Google Scholar]
- Therneau T. M., Grambsch P. M., Therneau T. M., Grambsch P. M. (2000). The Cox Model. New York, NY: Springer. [Google Scholar]
- Therneau T. M., Lumley T. (2015). Package ‘survival'. R. Top. Doc. 128, 28–33. [Google Scholar]
- Tomczak K., Czerwińska P., Wiznerowicz M. (2015). Review the cancer genome atlas (TCGA): an immeasurable source of knowledge. Contemp. Oncol. 2015, 68–77. 10.5114/wo.2014.47136 [DOI] [PMC free article] [PubMed] [Google Scholar]
- Tong D., Tian Y., Zhou T., Ye Q., Li J., Ding K., et al. (2020). Improving prediction performance of colon cancer prognosis based on the integration of clinical and multi-omics data. BMC Med. Inform. Decis. Mak. 20, 1–15. 10.1186/s12911-020-1043-1 [DOI] [PMC free article] [PubMed] [Google Scholar]
- Tong L., Mitchel J., Chatlin K., Wang M. D. (2020). Deep learning based feature-level integration of multi-omics data for breast cancer patients survival analysis. BMC Med. Inform. Decis. Mak. 20, 1–12. 10.1186/s12911-020-01225-8 [DOI] [PMC free article] [PubMed] [Google Scholar]
- Tong L., Wu H., Wang M. D. (2021). Integrating multi-omics data by learning modality invariant representations for improved prediction of overall survival of cancer. Methods 189, 74–85. 10.1016/j.ymeth.2020.07.008 [DOI] [PubMed] [Google Scholar]
- Tsimberidou A.-M., Hong D. S., Wheler J. J., Falchook G. S., Janku F., Naing A., et al. (2019). Long-term overall survival and prognostic score predicting survival: the impact study in precision medicine. J. Hematol. Oncol. 12, 1–12. 10.1186/s13045-019-0835-1 [DOI] [PMC free article] [PubMed] [Google Scholar]
- Unterhuber M., Kresoja K.-P., Rommel K.-P., Besler C., Baragetti A., Klöting N., et al. (2021). Proteomics-enabled deep learning machine algorithms can enhance prediction of mortality. J. Am. Coll. Cardiol. 78, 1621–1631. 10.1016/j.jacc.2021.08.018 [DOI] [PubMed] [Google Scholar]
- Vahabi N., McDonough C. W., Desai A. A., Cavallari L. H., Duarte J. D., Michailidis G. (2021). Cox-smbpls: an algorithm for disease survival prediction and multi-omics module discovery incorporating cis-regulatory quantitative effects. Front. Genet. 12:701405. 10.3389/fgene.2021.701405 [DOI] [PMC free article] [PubMed] [Google Scholar]
- Van Belle V., Pelckmans K., Suykens J. A., Van Huffel S. (2007). “Support vector machines for survival analysis,” in Proceedings of the Third International Conference on Computational Intelligence in Medicine and Healthcare (cimed2007: ), 1–8. [Google Scholar]
- Van Buuren S., Boshuizen H. C., Knook D. L. (1999). Multiple imputation of missing blood pressure covariates in survival analysis. Stat. Med. 18, 681–694. 10.1002/(SICI)1097-0258(19990330)18:6<681::AID-SIM71>3.0.CO;2-R [DOI] [PubMed] [Google Scholar]
- Vickers A. J., Elkin E. B. (2006). Decision curve analysis: a novel method for evaluating prediction models. Med. Decis. Making 26, 565–574. 10.1177/0272989X06295361 [DOI] [PMC free article] [PubMed] [Google Scholar]
- Voet D., Lin P., Lichtenstein L. R. Z., II., Saksena G., Noble M., Cibulskis K., et al. (2022). Firehose: An Analysis Infrastructure. Harvard: Firehose Broad GDAC, Broad Institute of MIT, 1. [Google Scholar]
- Wang C., Lue W., Kaalia R., Kumar P., Rajapakse J. C. (2022). Network-based integration of multi-omics data for clinical outcome prediction in neuroblastoma. Sci. Rep. 12:15425. 10.1038/s41598-022-19019-5 [DOI] [PMC free article] [PubMed] [Google Scholar]
- Wang J., Liu Y., Zhang R., Liu Z., Yi Z., Guan X., et al. (2023). Multi-omics fusion analysis models with machine learning predict survival of HER2-negative metastatic breast cancer: a multicenter prospective observational study. Chin. Med. J. 136, 863–865. 10.1097/CM9.0000000000002625 [DOI] [PMC free article] [PubMed] [Google Scholar]
- Wang Q., Yang C., Kuo C. S., Hsu P., Chang J.-C., Wu C. (2023). 572P multivariable five-year survival prediction model for prognosing patients with egfr-mutated nsclc treated with EGFR-TKIs. Ann. Oncol. 34:S1694. 10.1016/j.annonc.2023.10.650 [DOI] [Google Scholar]
- Wang X., Chen J., Lin L., Li Y., Tao Q., Lang Z., et al. (2023). Machine learning integrations develop an antigen-presenting-cells and T-cells-infiltration derived lncRNA signature for improving clinical outcomes in hepatocellular carcinoma. BMC Cancer 23, 1–16. 10.1186/s12885-023-10766-w [DOI] [PMC free article] [PubMed] [Google Scholar]
- Wang Z., Yan R., Liu J., Liu Y., Ren F., Zheng C., et al. (2020). “An integration framework for liver cancer subtype classification and survival prediction based on multi-omics data,” in Intelligent Computing Methodologies: 16th International Conference, ICIC 2020, Bari, Italy, October 2-5, 2020, Proceedings, Part III 16 (Springer: ), 247–257. [Google Scholar]
- Wekesa J. S., Kimwele M. (2023). A review of multi-omics data integration through deep learning approaches for disease diagnosis, prognosis, and treatment. Front. Genet. 14:1199087. 10.3389/fgene.2023.1199087 [DOI] [PMC free article] [PubMed] [Google Scholar]
- Westerlund A. M., Hawe J. S., Heinig M., Schunkert H. (2021). Risk prediction of cardiovascular events by exploration of molecular data with explainable artificial intelligence. Int. J. Mol. Sci. 22:10291. 10.3390/ijms221910291 [DOI] [PMC free article] [PubMed] [Google Scholar]
- Weston S. J., Ritchie S. J., Rohrer J. M., Przybylski A. K. (2019). Recommendations for increasing the transparency of analysis of preexisting data sets. Adv. Methods Pract. Psychol. Sci. 2, 214–227. 10.1177/2515245919848684 [DOI] [PMC free article] [PubMed] [Google Scholar]
- Wiegrebe S., Kopper P., Sonabend R., Bender A. (2023). Deep learning for survival analysis: a review. arXiv [preprint] arXiv:2305.14961. 10.1007/s10462-023-10681-3 [DOI] [Google Scholar]
- Willems A., Panchy N., Hong T. (2023). Using single-cell RNA sequencing and microrna targeting data to improve colorectal cancer survival prediction. Cells 12:228. 10.3390/cells12020228 [DOI] [PMC free article] [PubMed] [Google Scholar]
- Wissel D., Janakarajan N., Grover A., Toniato E., Martínez M. R., Boeva V. (2022). Survboard: standardised benchmarking for multi-omics cancer survival models. bioRxiv. 10.1101/2022.11.18.51704330642095 [DOI] [Google Scholar]
- World Health Organization (2020). The Top 10 Causes of Death. Available online at: https://www.who.int/news-room/fact-sheets/detail/the-top-10-causes-of-death (accessed December 9, 2020).
- Wu W., Wang Y., Xiang J., Li X., Wahafu A., Yu X., et al. (2022). A novel multi-omics analysis model for diagnosis and survival prediction of lower-grade glioma patients. Front. Oncol. 12:729002. 10.3389/fonc.2022.729002 [DOI] [PMC free article] [PubMed] [Google Scholar]
- Wu X., Fang Q. (2022). Stacked autoencoder based multi-omics data integration for cancer survival prediction. arXiv [preprint] arXiv:2207.04878. 10.48550/arXiv.2207.04878 [DOI] [Google Scholar]
- Wu Z., Uhl B., Gires O., Reichel C. A. (2023). A transcriptomic pan-cancer signature for survival prognostication and prediction of immunotherapy response based on endothelial senescence. J. Biomed. Sci. 30:21. 10.1186/s12929-023-00915-5 [DOI] [PMC free article] [PubMed] [Google Scholar]
- Xu Z., Arnold M., Stevens D., Kaptoge S., Pennells L., Sweeting M. J., et al. (2021). Prediction of cardiovascular disease risk accounting for future initiation of statin treatment. Am. J. Epidemiol. 190, 2000–2014. 10.1093/aje/kwab031 [DOI] [PMC free article] [PubMed] [Google Scholar]
- Yang H., Jin W., Liu H., Wang X., Wu J., Gan D., et al. (2020). A novel prognostic model based on multi-omics features predicts the prognosis of colon cancer patients. Mol. Genet. Genom. Med. 8:e1255. 10.1002/mgg3.1255 [DOI] [PMC free article] [PubMed] [Google Scholar]
- Yang Q., Xiong Y., Jiang N., Zeng F., Huang C., Li X. (2020). Integrating genomic data with transcriptomic data for improved survival prediction for adult diffuse glioma. J. Cancer 11:3794. 10.7150/jca.44032 [DOI] [PMC free article] [PubMed] [Google Scholar]
- Yin Q., Chen W., Zhang C., Wei Z. (2022). A convolutional neural network model for survival prediction based on prognosis-related cascaded WX feature selection. Lab. Investig. 102, 1064–1074. 10.1038/s41374-022-00801-y [DOI] [PubMed] [Google Scholar]
- Yu C.-N., Greiner R., Lin H.-C., Baracos V. (2011). Learning patient-specific cancer survival distributions as a sequence of dependent regressors. Adv. Neural Inf. Process. Syst. 24, 1845–1853. [Google Scholar]
- Yu J., Wu X., Lv M., Zhang Y., Zhang X., Li J., et al. (2020). A model for predicting prognosis in patients with esophageal squamous cell carcinoma based on joint representation learning. Oncol. Lett. 20, 1–10. 10.3892/ol.2020.12250 [DOI] [PMC free article] [PubMed] [Google Scholar]
- Zarean Shahraki S., Azizmohammad Looha M., Mohammadi kazaj P., Aria M., Akbari A., Emami H., et al. (2023). Time-related survival prediction in molecular subtypes of breast cancer using time-to-event deep-learning-based models. Front. Oncol. 13:1147604. 10.3389/fonc.2023.1147604 [DOI] [PMC free article] [PubMed] [Google Scholar]
- Zeng W., Wang X., Xu K., Zhang Y., Fu H. (2021). “Prediction of cardiovascular disease survival based on artificial neural network,” in 2021 IEEE International Conference on Computer Science, Electronic Information Engineering and Intelligent Control Technology (CEI) (New Jersey, NJ: IEEE; ), 219–224. [Google Scholar]
- Zhang J., Zhang M., Tian Q., Yang J. (2023). a novel model associated with tumor microenvironment on predicting prognosis and immunotherapy in triple negative breast cancer. Clin. Exp. Med. 23, 1–15. 10.1007/s10238-023-01090-5 [DOI] [PMC free article] [PubMed] [Google Scholar]
- Zhang J. Z., Xu W., Hu P. (2022). Tightly integrated multiomics-based deep tensor survival model for time-to-event prediction. Bioinformatics 38, 3259–3266. 10.1093/bioinformatics/btac286 [DOI] [PubMed] [Google Scholar]
- Zhang R., Wu J., Zhao Y., Xu X., Liu X., Wu J. (2022). Using integrated multi-omics data analysis to identify 5-gene signature for predicting survival of patients with hepatocellular carcinoma. [Preprint]. 10.21203/rs.3.rs-710165/v2 [DOI] [Google Scholar]
- Zhang S., Zeng X., Lin S., Liang M., Huang H. (2022). Identification of seven-gene marker to predict the survival of patients with lung adenocarcinoma using integrated multi-omics data analysis. J. Clin. Lab. Anal. 36:e24190. 10.1002/jcla.24190 [DOI] [PMC free article] [PubMed] [Google Scholar]
- Zhang W., Yu Y., Hertwig F., Thierry-Mieg J., Zhang W., Thierry-Mieg D., et al. (2015). Comparison of rna-seq and microarray-based models for clinical endpoint prediction. Genome Biol. 16, 1–12. 10.1186/s13059-015-0694-1 [DOI] [PMC free article] [PubMed] [Google Scholar]
- Zhang X., Xing Y., Sun K., Guo Y. (2021). Omiembed: a unified multi-task deep learning framework for multi-omics data. Cancers 13,:3047. 10.3390/cancers13123047 [DOI] [PMC free article] [PubMed] [Google Scholar]
- Zhang Z.-S., Xu F., Jiang H.-J., Chen Z.-H. (2021). “Prognostic prediction for non-small-cell lung cancer based on deep neural network and multimodal data,” in Intelligent Computing Theories and Application: 17th International Conference, ICIC 2021, Shenzhen, China, August 12-15, 2021, Proceedings, Part III 17 (Cham: Springer; ), 549–560. [Google Scholar]
- Zhao L., Dong Q., Luo C., Wu Y., Bu D., Qi X., et al. (2021). Deepomix: a scalable and interpretable multi-omics deep learning framework and application in cancer survival analysis. Comput. Struct. Biotechnol. J. 19, 2719–2725. 10.1016/j.csbj.2021.04.067 [DOI] [PMC free article] [PubMed] [Google Scholar]
- Zhao Y., Wong L., Goh W. W. B. (2020). How to do quantile normalization correctly for gene expression data analyses. Sci. Rep. 10:15534. 10.1038/s41598-020-72664-6 [DOI] [PMC free article] [PubMed] [Google Scholar]
- Zhao Z., Zhang K.-N., Wang Q., Li G., Zeng F., Zhang Y., et al. (2021). Chinese glioma genome atlas (CGGA): a comprehensive resource with functional genomic data from chinese glioma patients. Genom. Proteom. Bioinf. 19, 1–12. 10.1016/j.gpb.2020.10.005 [DOI] [PMC free article] [PubMed] [Google Scholar]
- Zheng X., Amos C. I., Frost H. R. (2021). Pan-cancer evaluation of gene expression and somatic alteration data for cancer prognosis prediction. BMC Cancer 21, 1–11. 10.1186/s12885-021-08796-3 [DOI] [PMC free article] [PubMed] [Google Scholar]
- Zhou H.-F., Wang J.-L., Yang W., Zhou C., Shen Y., Wu L.-L., et al. (2023). Survival prediction for patients with malignant biliary obstruction caused by pancreatic cancer undergoing biliary drainage: the combo-pas model. Surg. Endosc. 37, 1943–1955. 10.1007/s00464-022-09698-6 [DOI] [PubMed] [Google Scholar]
- Zhou L., Rueda M., Alkhateeb A. (2021). “Identifying biomarkers of nottingham prognosis index in breast cancer survivability,” in Proceedings of the 12th ACM Conference on Bioinformatics, Computational Biology, and Health Informatics (New York, NY: ACM; ), 1–9. [Google Scholar]
- Zhu M., Chen L., Kong X., Wang X., Li X., Fang Y., et al. (2023). The systemic immune-inflammation index is an independent predictor of survival in breast cancer patients. Cancer Manag. Res. 775–820. 10.2147/CMAR.S346406 [DOI] [PMC free article] [PubMed] [Google Scholar]
Associated Data
This section collects any data citations, data availability statements, or supplementary materials included in this article.
Supplementary Materials
Data Availability Statement
The original contributions presented in the study are included in the article/Supplementary material, further inquiries can be directed to the corresponding author.