
Fig. 4.
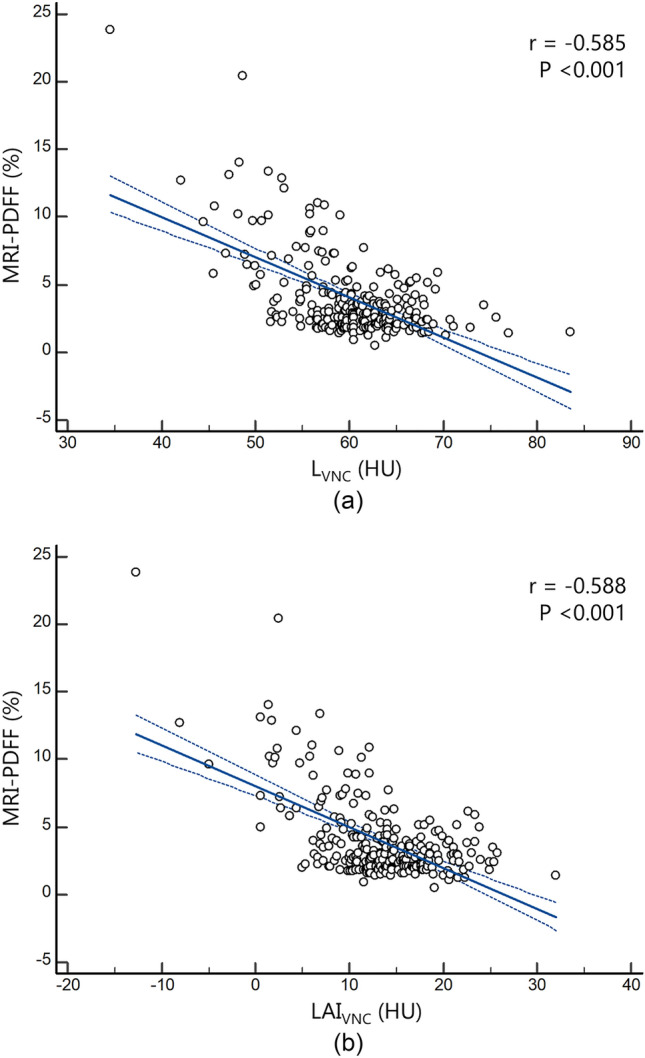
Scatter plots displaying the regression line (solid) and 95% confidence interval (dotted) of virtual non-contrast (VNC) parameters for hepatic steatosis (a: LVNC and b: LAIVNC) with MRI-PDFF values. ‘r’ denotes Pearson’s correlation coefficient. L = volumetric mean CT attenuation values of the liver; S = volumetric mean CT attenuation values of the spleen; LAI = liver attenuation index, defined as L minus S; MRI-PDFF = magnetic resonance imaging-proton density fat fraction