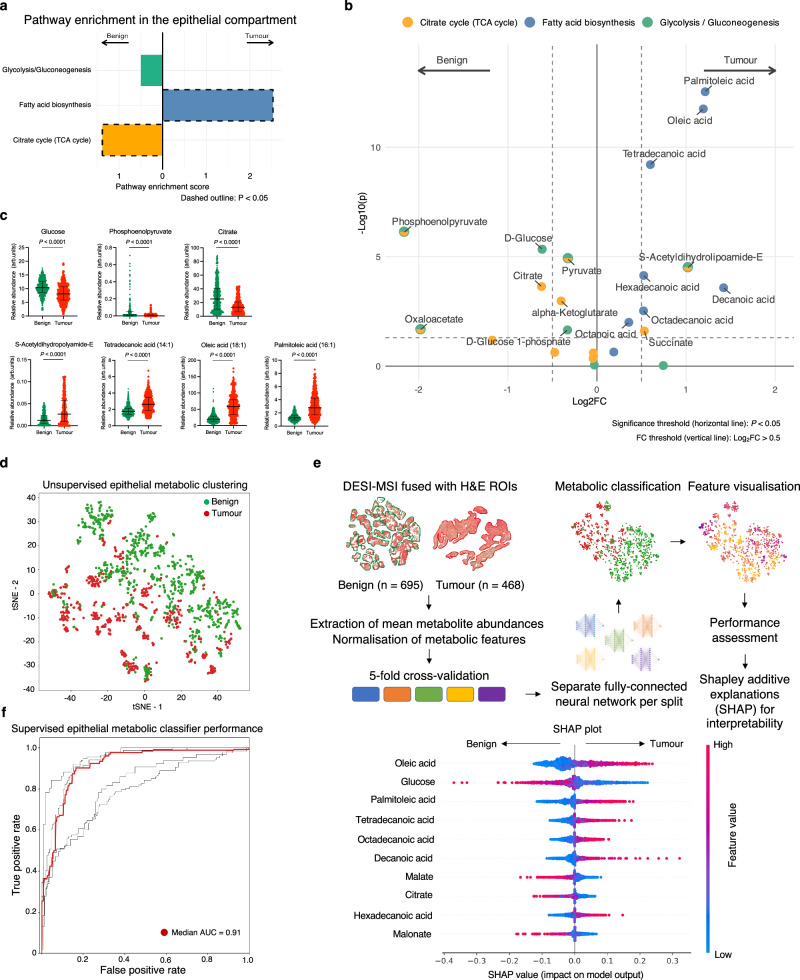
Fig. 4. Spatially resolved metabolic profiling of the benign and malignant prostatic epithelium.
a Outputs of the DESI-MSI-derived MPEA demonstrating comparative enrichment of KEGG glycolysis, fatty acid biosynthesis, and TCA cycle pathways in benign (n = 695) and tumour (n = 468) ROIs from the spatial metabolomics cohort (n = 13 patients). b Volcano plot showing individual differentially enriched metabolites from the three KEGG pathways between the benign and tumour ROIs; P were derived using the FDR-corrected Wilcoxon rank sum test. c Mixed box-and-whisker and scatterplots comparing epithelial abundance of the key differentially enriched metabolites between benign and tumour epithelial ROIs; the data are presented as median and interquartile range; P were derived using the two-tailed Mann–Whitney U test; the sample size in each plot varies depending on the number of outliers excluded using the ROUT method (Q = 5%). For illustrative purposes, outliers were removed using the ROUT method104 with Q = 5%. d tSNE plot of DESI-MSI data acquired from the benign and tumour ROIs focusing on ions corresponding to metabolites related to the three KEGG pathways. e Summary diagram describing the key steps in developing a deep learning based metabolic tissue classifier using DESI-MSI derived metabolites from the three KEGG pathways to discriminate between benign and tumour epithelial ROIs; the SHAP plot lists the ten most important metabolites used by the final model to achieve a median performance of 0.91 presented in an AUC plot in f. Source data are provided as a Source Data file.

