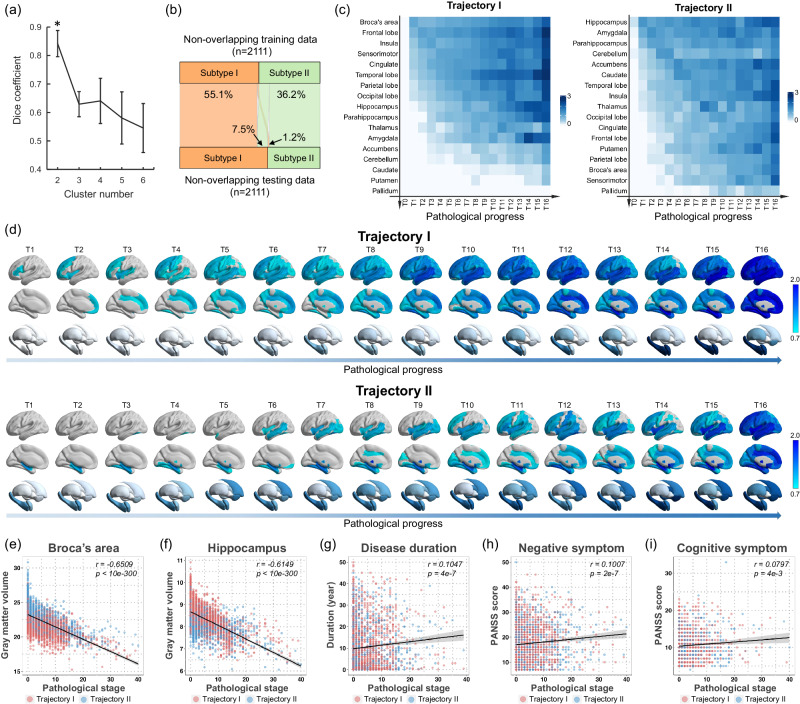
Fig. 1. Two pathophysiological progression trajectories in schizophrenia.
a Dice coefficient indicates that K = 2 is the optimal number (marked by asterisk) of subtypes with best consistency of the subtype labeling between two independent schizophrenia populations using non-overlap 2-folds cross-validation procedure. This procedure was repeated ten times (n = 10) to avoid the occasionality of one split. Data are presented as median values +/- standard deviation (SD). b The proportion of individuals whose subtype labels keep consistent by a non-overlap cross-validation procedure. c Sequences of regional volume loss across seventeen brain regions for each ‘trajectory’ via SuStaIn are shown in y-axis. The heatmap shows regional volume loss in which biomarker (y-axis) in a particular ‘temporal’ stage (T0-T16) in the ‘trajectory’ (x-axis). The Color bar represents the degree of gray matter volume (GMV) loss in schizophrenia relative to healthy controls (i.e., z score). d Spatiotemporal pattern of pathophysiological ‘trajectory’. The z-score images are mapped to a glass brain template for visualization. The spatiotemporal pattern of gray matter loss displays a progressive pattern of spatial extension along with later ‘temporal’ stages of pathological progression that are distinct between trajectories. e–f Pathological stages of SuStaIn are correlated with reduced gray matter volume of Broca’s area and hippocampus. g–i Pathological stages of SuStaIn are correlated with longer disease duration, worse negative symptoms and worse cognitive symptoms. Spearman correlation test is conducted for data analysis in figures (e–i). Two-sided p value is reported after multiple comparisons correction by FDR. The error bands in figures (e–i) represent 95% confidence interval. n = 4222 biologically independent samples in figures (e–f). n = 2333 biologically independent samples in figure (g). n = 2651 biologically independent samples in figure (h). n = 1322 biologically independent samples in figure (i).

