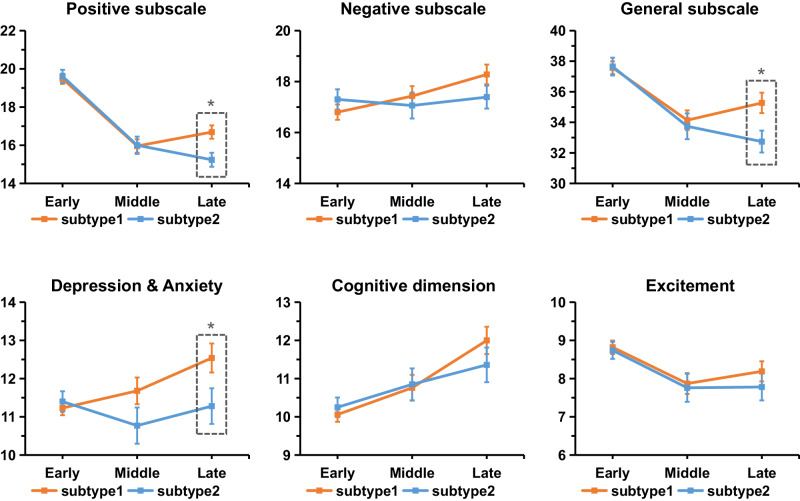
Fig. 4. Symptomatic trajectories across three stages of disease duration.
Individuals of each subtype are divided into three subgroups according to their illness durations (early stage: ≤2 years; middle stage: 2−10 years; late stage: >10 years). Two sample t test was performed to compare the inter-subtype difference separately within each of the stages after regressing out the effects of age, sex and SuStaIn stage. * two-sided p < 0.05, uncorrected. At the late stage, subtype 1 exhibited worse positive symptom (t = 2.9, p = 0.003), general psychopathology (t = 2.5, p = 0.010) and worse depression/anxiety (t = 2.1, p = 0.033) compared to subtype 2. Data are presented as mean values +/- standard error (se). n = 579 (347), 362 (216), and 400 (282) biologically independent samples in the early stage, middle stage and late stage in subtype 1 (subtype 2) for positive, negative and general subscales. n = 377 (220), 144 (86), and 166 (109) biologically independent samples in the early stage, middle stage and late stage in subtype 1 (subtype 2) for depression & anxiety, cognitive dimension and excitement dimension.

