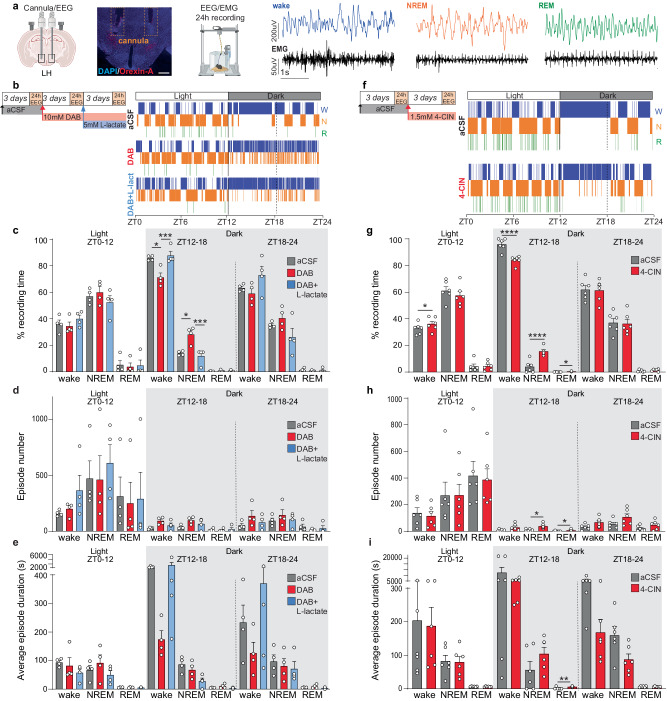
Fig. 1. Blockage of glycogenolysis or MCTs in the LH reduces wakefulness during the dark phase.
a (Left to right) Cartoon representing implantation of bilateral cannula in the LH for drug delivery coupled with EEG/EMG recording. Immunofluorescence micrograph showing placement of the cannula (orange squares) near to Orexin-A positive cells (red). Scale bar = 100 µm. Schematic representation of EEG/EMG recording setting and representative traces for EEG and EMG during wakefulness, NREM and REM. Experimental design and timeline for DAB and DAB + L-lactate infusion (b) and 4-CIN infusion (f). Representative hypnograms of the same WT mouse in the different conditions during 24 h EEG recordings (W – wake; N – NREM and R – REM). Quantification of the averaged percentage of time spent in wake, NREM, or REM before and after DAB, DAB + L-lactate (c) or 4-CIN treatment (g) during the 24 h recording phase. Average of the number of wake, NREM, and REM episodes during the 24 h recording phase before and after DAB, DAB + L-lactate (d) or 4-CIN (h). Average duration of wake, NREM, and REM episodes during the 24 h recording phase before and after DAB, DAB + L-lactate (e) or 4-CIN infusion (i). (c, d and e: n = 4, Repeated-measure ANOVA followed by Tukey’s post hoc test; ZT12-18 %wake *p = 0.033, ***p = 0.0009, %NREM *p = 0.030, ***p = 0.0006; aCSF infusion in gray, DAB infusion in red, DAB + L-lactate infusion in blue; g, h and i: n = 6, two-tailed paired t test; ZT0-12 %wake *p = 0.039, ZT12-18 %wake and %NREM: ****p < 0.0001, %REM *p = 0.049, episode number REM *p = 0.022, episode number NREM *p = 0.042, episode duration REM *p = 0.009; aCSF infusion in gray, 4-CIN infusion in red). ZT= Zeitgeber Time; EEG= electroencephalogram; EMG=electromyography; DAB = 1,4-dideoxy-1,4-imino-d-arabinitol; 4-CIN=alpha-cyano-4-hydroxycinnamate. Pooled data are shown as mean ± SEM. Source data are provided as a Source Data file.

