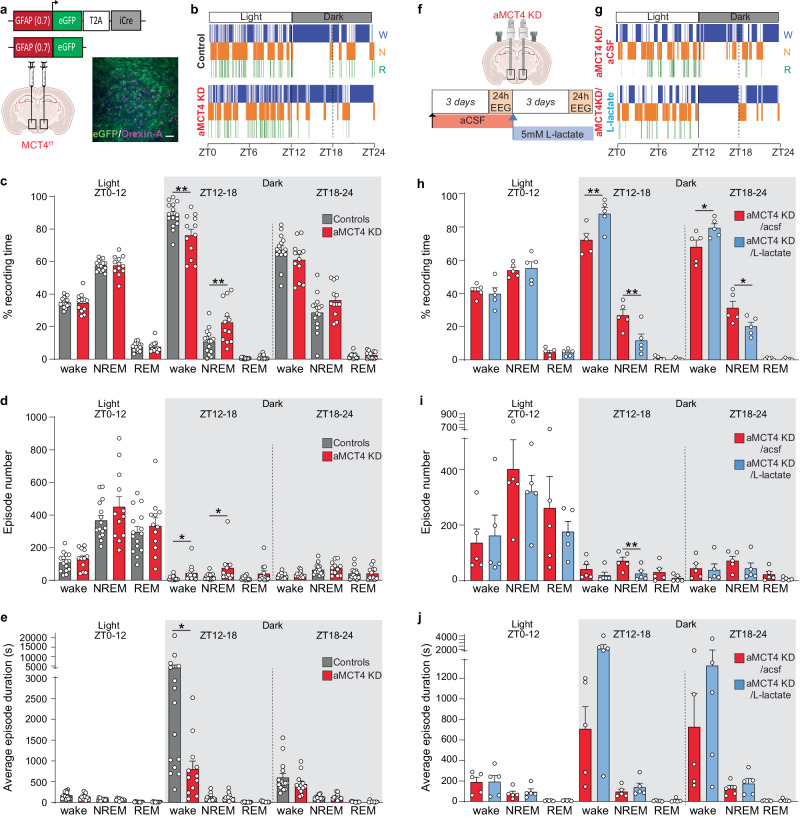
Fig. 2. Deletion of astrocytic MCT4 induces excessive sleepiness during the dark phase and is rescued by exogenous lactate.
a Schematic of stereotaxic injections of either Cre-encoding PhP.eB virus (aMCT4 KD mice) or control PhP.eB virus (control mice) in the LH of MCT4f/f mice and immunofluorescence micrograph showing eGFP expression (green) near Orexin-A (magenta) positive cells 12 weeks after virus injection. Scale bar = 100 µm. Representative hypnograms of Control mouse and aMCT4 KD mouse during 24 h EEG recordings (b) or same aMCT4 KD before and after L-lactate infusion (g) (W – wake; N – NREM and R – REM). Quantification of the average percentage of time spent in wake, NREM or REM sleep during the 24 h recording phase in aMCT4 KD mice compared to control mice (c) or in aMCT4 KD mice before and lactate infusion (h). Average of the number of wake, NREM and REM episodes during the 24 h recording phase in aMCT4 KD mice compared to control mice (d) or in aMCT4 KD mice before and after lactate infusion (i). Average duration of the wake, NREM and REM episodes during the 24 h recording phase in aMCT4 KD mice compared to control mice (e) or in aMCT4 KD mice before and lactate infusion (j) (c, d, e: red, aMCT4 KD n = 12; gray, controls n = 15, two-tailed unpaired t test; ZT12-18: %wake **p = 0.005, %NREM p = 0.006; episode number wake *p = 0.033, episode number NREM *p = 0.040, episode duration wake *p = 0.048; h, i, j: n = 5, two-tailed paired t test; ZT12-18 %wake and %NREM **p = 0.003; ZT18-24 %wake *p = 0.039, %NREM *p = 0.043; ZT12-18 episode number NREM **p = 0.005). ZT = Zeitgeber Time. Pooled data are shown as mean ± SEM. f Experimental design and timeline for L-lactate infusion; 24 h EEG recordings were analyzed over time in the same aMCT4 KD mouse. Source data are provided as a Source Data file.

